Qlik Business Intelligence and Analytics

Gartner Recognises Qlik As An Analytics & BI Leader in 2018 Magic Quadrant

Gartner 2018 Analytics & Business Intelligence Magic Quadrant & Qlik a Leader

Gartner has just released its 2018 Analytics & Business Intelligence Magic Quadrant Report, and the Qlik business analytics platform has been named a Leader for the eighth consecutive year.   You can download a complimentary copy of the report here. https://www.insideinfo.com.au/qlik-business-intelligence-and-analytics/2018-gartner-analytics-business-intelligence-magic-quadrant According to Gartner in the report:

"Qlik's position in the Leaders quadrant is driven by progress on its roadmap for augmented analytics, improvements in marketing strategy, and ease of use." While Qlik's enterprise governance and Associative Engine for free-form analysis have continued to dominate as a differentiator.  

Different at the Core

Early on, Qlik set out to solve the biggest problem with modern BI tools – restricted linear exploration. Qlik’s unique associative technology brings all data together without complex data warehouses, and enables users to freely explore in any direction they want, leaving no data behind, and no path uncovered. The ability to combine all data sources quickly and easily, search and explore without limitation and pivot your line of thinking based on what you see is the core differentiator at the heart of Qlik’s leadership in the industry.

This free form exploration is valuable because insights come from truly understanding the data from all angles. To do so across an organisation, it is critical to elevate the level of data literacy of all users.

Over years of continued innovation and changing the face of BI, Qlik maintains its belief that all people need to drive analysis from any data source – on premise, in the cloud, in a hybrid environment, internal or external – without restriction or limitation.

Qlik continues to expand the market by delivering an extensible, cloud-ready platform that companies of all sizes can consider the centerpiece of their analytics strategy. Qlik Sense® is built on a fully integrated, cloud-ready platform powered by the patented Associative Indexing Engine. Qlik Sense combines enterprise readiness and governance with intuitive visualization and exploration, advanced analytics and self-service data preparation capabilities. This breadth and depth allows organisations to meet the broadest range of BI use cases from a single platform leading to consistent, data-driven decision making. With a flexible, low-cost monthly subscription, streamlined administration and a fully web-based experience, customers can benefit from Qlik Sense Cloud Business® with no capital costs or commitments. And through its open APIs, Qlik offers integration with best-in-class natural language generation and processing, advanced predictive analytics, and an immersive experience including augmented intelligence.

Download the Report

Gartner Disclaimer

Gartner does not endorse any vendor, product or service depicted in its research publications and does not advise technology users to select only those vendors with the highest ratings or other designation. Gartner research publications consist of the opinions of Gartner's research organization and should not be construed as statements of fact. Gartner disclaims all warranties, expressed or implied, with respect to this research, including any warranties of merchantability or fitness for a particular purpose.

How Can An Australian Company Start Analysing Big Data?

How Can An Australian Company Start Analysing Big Data?

There is a lot of comment on Big Data and what it is, but according to the Telsyte Big Data market study, one in four Australian businesses lack a Big Data strategy as the main blocker for their IoT adoption, despite the fact 83% of these CIO’s plan to invest more in Big Data platforms. Here we’ll provide some useful tips on how an Australian company can start analysing Big Data to gain a competitive advantage using technologies such as the Qlik business intelligence (BI) software platform.  

Businesses are now able to capture, store, and process an incredible amount of data about almost everything. But a Big Data repository has no inherent value, and many companies that have invested heavily in Big Data technologies are still learning how to leverage it.

According to a recent Telsyte Australian Big Data & Analytics Market Study in 2017, more than half of Australian CIOs expect a fivefold or higher increase in the number of connected devices in their enterprise within the next five years, but one in four organisations note that a lack of a Big Data strategy is a blocker for their IoT adoption. Despite this, 83% of Australian CIO's plan to invest more on Big Data platforms.

83% of Australian CIO's plan to invest more on Big Data platforms.

A Quick Recap On What Big Data Is

Big data is the term that describes the large volume of data - both structured and unstructured - that inundates a business on a day-to-day basis. Usually characterised by analysts around:

  • Volume - the amount of data to collect and store from varying sources such as business transactions, social media and information from sensor or machine-to-machine data, IoT.
  • Velocity - The speed at which data streams. RFID tags, sensors and smart metering are driving the need to deal with torrents of data in near real-time.
  • Variety - The different types of formats data comes in - from structured numeric data in traditional databases to unstructured text documents, email, video, audio, stock ticker data and financial transactions.

Big Data flows can be highly inconsistent with periodic peaks which makes data loads challenging to manage, especially with unstructured data. The fact that data also comes from multiple sources, makes it difficult to link, match, cleanse and transform across systems. It’s necessary to connect and correlate relationships, hierarchies and multiple data linkages or your data can quickly get out of control.

It’s important to remember that the primary value from Big Data comes not from the data in its raw form, but from the processing and analysis of it and the insights, products, and services that emerge from analysis. The sweeping changes in Big Data technologies and management approaches need to be accompanied by similarly dramatic shifts in how data supports decisions and product/service innovation.

According to the Telsyte study, 30% of Australian enterprises who are using or planning to use, Big Data, are looking at predictive analytics.  

What Type Of Big Data Applications Are Australian Businesses Using?

Telsyte found the intention to use Big Data analytics are high across a range of applications for Australian businesses, including financial modelling, customer interaction, security and fraud detection, retail sales and ecommerce, and IoT and machine to machine infrastructure.

Sales and marketing applications are one of the top three line of business use cases flagged by CIOs – one third of whom say they are looking to use Big Data analytics for this application.

However uptake is lagging for marketing teams, with just 15% of marketing departments having implemented Big Data analytics. So an opportunity exists here for the marketers among us to lead in this area as a means to differentiate. 

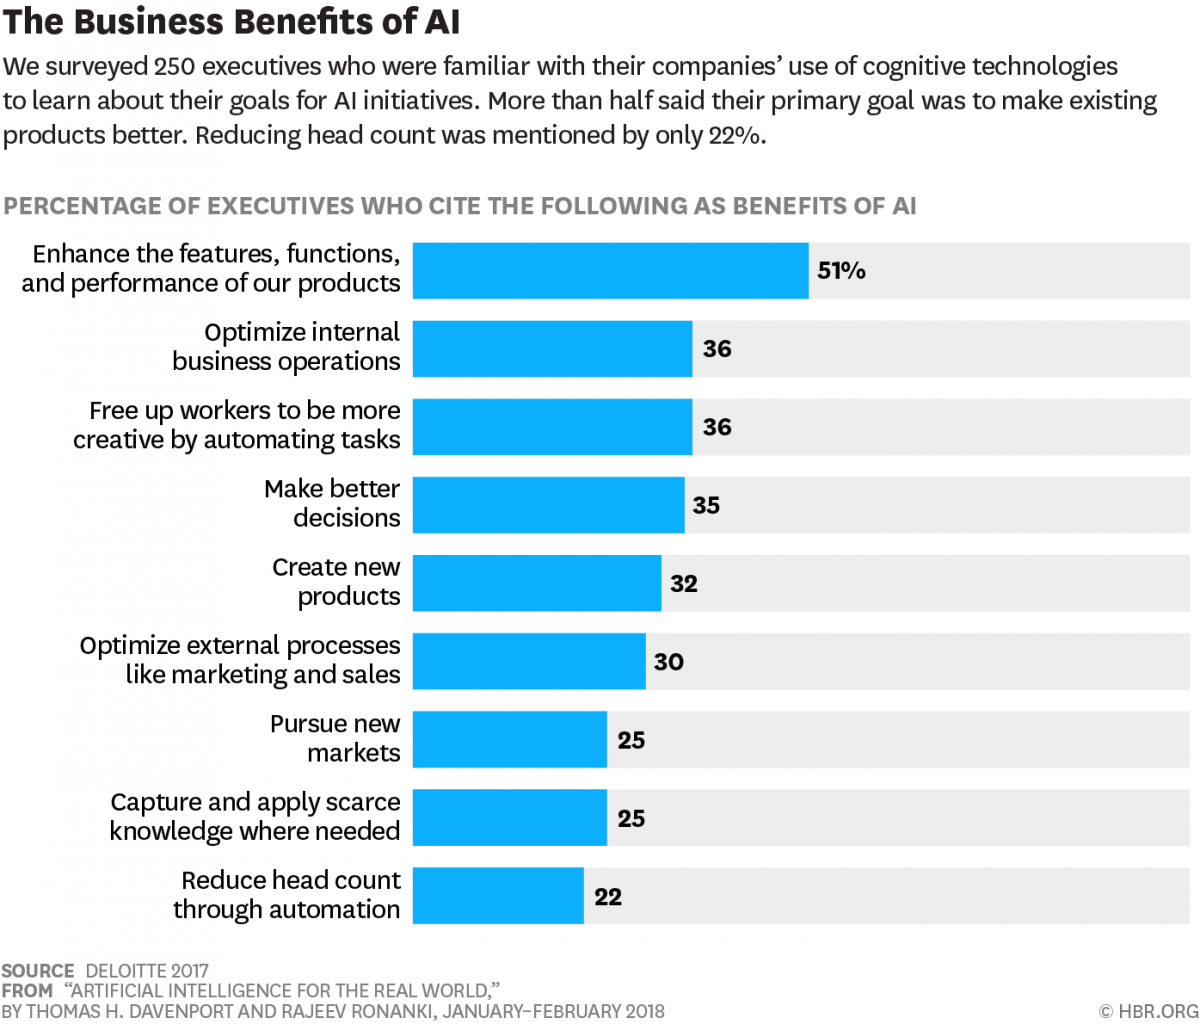
The benefits Australian CIO’s are seeking from their Big Data and analytics strategies are to improve productivity and decision making, with better product and service development now the number one business priority for Australian IT leaders.

However, the main barriers to adoption are factors such as software costs, lack of in-house skills and IT infrastructure requirements.

Companies like Woolworths are taking a big leap into the Big Data game, investing some years ago a quarter of a billion dollars into its Big Data endeavours in order to better analyse its consumers’ online and in-store spending habits. While Telstra uses Big Data to improve its marketing strategies and customer service by analysing massive amounts of consumer data in real-time. One of our long-standing clients, Qantas, has deployed Qlik Sense to reduce the impact of flight disruptions and maximise occupancy on planes by coupling data from its business applications with external weather and flight path data.

Where Do I Start?

The first question you need to ask before diving into Big Data analysis is what problem are you trying to solve? Having now looked at what others are doing, are you interested in predicting customer behaviour to prevent churn? Do you want to analyse the driving patterns of your customers for insurance premium purposes? Are you interested in looking at your system log data to ultimately predict when problems may occur? The kind of high level problem is going to drive the analytics you use. If you’re not sure, you can always look at what areas of the business that need improvement.

Once you’ve chosen one simple, well-defined issue, explore it and demonstrate a little value. Repeat those steps, over and over. Begin by taking a manageable sample of your data that’s suitable for the analysis you want to perform - this might prove difficult if your data is spread across disparate data sources, or might be in one database that requires complex queries to get the sample you’re after. You need to think about the data you need and how it needs to be organised. Identify any special requirements (such as legal) for handling the data and ensure compliance.

The sources for Big Data generally fall into one of three categories:

  • Streaming Data - this is data that reaches your IT systems from a web of connected devices. You can analyse this information as it arrives.
  • Social media data - this is data on social interactions, particularly relevant for marketing, sales and support functions. It’s often unstructured or semi structured so often poses a challenge.
  • Publicly available sources - Massive amounts of data are available through open data sources.

After you’ve identified the potential sources of data, you’ll need to consider how to store and manage that data, how much of it to analyse and how you’ll use the insights you uncover. Once you’ve got your sample you can perform data exploration, analysis and modelling. Try and keep your models simple to start with and rely on the same analytic methods you would use for any other data source.

Make Big Data Accessible To the Whole Business

Real value from Big Data is created when businesses can bring together data - big or traditional - from multiple sources or locations, and present that information in a way that encourages exploration and insight.

The ability to make Big Data accessible to the entire business drives value in two important ways. First, it means organisations are including Big Data sources into standard business analysis, thus gaining more detailed insight into key aspects of its operation. Second, it fosters a culture of inquiry in which experience and gut feel is supplemented with the power of Big Data. One of the significant issues expressed by IT leaders around the topic of Big Data is the struggle to find the ‘needle in the haystack’. By making Big Data accessible, more people will experiment with ideas around their data, eventually leading to greater business value.

Getting Insight Is As Much About Relating Data As It Is Collecting It

There are many tools focused on improving the ability for data scientists to perform analysis on massive amounts of data. But it’s important to go beyond the data scientist and empower all business users to perform analysis, regardless of technical skill. If we look at Qlik BI software as a case in point, it does this through:

  • A complete view of information - Qlik’s data integration tools bring together multiple disparate data sources to provide a comprehensive picture of the business. Qlik can connect to virtually any data source - including file-based sources like Excel and XML web content, application specific data like Salesforce, ERP etc and Big Data sources like Hadoop, Teradata and Cloudera.
  • Interactive, free-form exploration & analysis - Qlik’s patented, Associative Engine ensures that every piece of data is dynamically associated with every other piece of data, across all data sources. These associations can be extremely useful if there are hundreds or thousands of products, customers, geographies, etc. Such extremely large datasets can be sliced with a few clicks rather than scrolling through thousands of items. Context and relevance go hand in hand and quickly take what seemed to be a Big Data problem down to something that is quite manageable without any programming or advanced visualisation skills
  • Multiple methods to support Big Data - Because Big Data use cases and infrastructure differ in every organisation, Qlik offers multiple techniques - which can be used individually or in combination - to best meet your Big Data needs. Such as:
  • In-memory - Utilising the Qlik Indexing engine (QIX) optimisation of in-memory storage to compress data down to 10% of its original size.
  • Segmentation and chaining - Sectioning multifaceted data views into subject-specific views and then chaining these separate views with each other.
  • On Demand App Generation - Empowering the user to automatically create a purpose-built analysis app every time they select a slice of a very large data source.
  • Other methods - A robust set of Qlik APIs as well as a variety of partner technologies can be used for situations like a custom User Interface.

Australian businesses are gearing up to continue to invest in Big Data analytics as a source of differentiation, particularly to improve products and services, however the key is to bring together data - big or traditional - from multiple sources or locations, and present that information in a way that encourages exploration and insight. If you’d like to know more about how Inside Info and Qlik can help you with Big Data analytics, check out this ebook on 10 Ways To Transform Big Data Into Big Value.

Download ebook

When to use data analytics: Are you in these situations?

When to use data analytics: Are you in these situations?

When should businesses use data analytics to inform strategic and operational decisions?  Here we’ll explore some common situations that businesses can face and discuss when to use data analytics or business intelligence (BI) tools like Qlik BI software, to make better use of the ever-increasing deluge of data at their disposal. Are you experiencing any of these situations?  If so then data analytics might just be the key, so read on:

  • Competition is heating up or you’re operating in a mature market.

  • It’s difficult to see a consolidated view of performance across different systems, entities or divisions.

  • You’re struggling to agree across the business on a single version of the truth when it comes to the numbers.

  • You need better visibility into the customer, sales, marketing, supply chain, operations and their financial impacts.

  • You understand “what” is happening in the business, but not “why” it’s happening.

Competition is heating up or you’re in a mature market

To succeed in highly competitive markets or a more mature market that are usually categorised by plateauing or declining growth rates, business analytics can be a valuable tool to direct where to differentiate your customer and/or service/product experience.  Using analytics to understand exactly what products or services are contributing the most to underlying profit, in addition to those segments of the market you’re focusing on and the resource effort to get there, can shed valuable light on where to focus attention that will generate the best return.  In the retail sector for example, using basket analysis can shed light on trending product combinations that you may not have thought of that could be wrapped up in a promotion in the form of a bundled offering to drive additional sales.  While detailed point and click financial analytics across operations can assist all industries looking for areas to remove wastage and find efficiencies to operate more effectively. In fact, Research by McKinsey in 2016 estimates that analytics tools have increased gross margins for manufacturers by up to 40%, with as much as 15% of after-sales costs also being reduced. We recently wrote an article about using analytics in the highly competitive media sector which may be worth a look.

Do you need a consolidated view of performance?

Businesses buy, sell and evolve over time.  This evolution often gives rise to inheriting multiple business systems that many not talk to each other, coupled with many manual processes that usually find their way in, to extract the information that senior management or business leaders need, to be able to perform at their best each day.  This is where a data analytics solution can help.  An effective business intelligence platform will automate the integration of data from the many siloed divisions or entities across one company or the Group, through inbuilt connectors, to then provide management with complete transparency across operations looking at whatever metrics are important to them (revenue, profit, inventory turns, capital etc).   

You can’t agree on a single version of the truth

In a business sense we often refer to a single version of the truth as having commonality in how  a certain metric is calculated in a consistent way.  For example, the Sales Director may measure revenue based on booked revenue, but the CFO may measure revenue based on when it’s received.  If there’s no consistency in how key metrics are measured then performance can be misconstrued across departments.  Data analytics software will keep all the data in a single repository, whether this be a data warehouse or a data store within the analytics platform itself, that has set rules around how metrics are measured and calculated, so there’s no ambiguity. Then dashboards or applications are built to provide visibility into a particular business process or area, like supply chain, and these dashboards all source the data from this singular data source, meaning everyone is working from the same page.

Want better visibility into customers, operations and their financial impacts

If you’re capturing data about customers, suppliers, from machines (plant equipment, counters etc) or from social media, then this big data can add valuable context when applied with other financial data to understand how your business is performing or could improve.  Customer analytics can marry data from social media to gauge the mood of customers, identify any problem areas or messaging that may need to change in campaign activity.  Data analytics can help identify exactly what products or sales reps are your best performers by region, division, brand or profit contribution. Another useful analytics application is the use of Pocket Margin Databases (PMDB) that allocate all costs back to an invoice line level to best understand profit.  Orora use PMDB’s extensively from the CFO to every sales rep to analyse product, plant and customer profitability.  Margin erosion items can quickly be identified as too can improvement opportunities that could otherwise go unnoticed.  You can read more about Orora and Qlik here.

You want to understand “why” something is happening

You know sales are down and you’re losing clients to your competitor but understanding why this is happening is the critical question to be able to answer.  This is where data analytics helps.  Dashboards that allow business leaders and teams the ability to freely interrogate the data through point and click analysis is usually better here to uncover insights. In our example, Qlik business intelligence (BI) software allows users the ability to cross filter the data by simply clicking in their dashboard on region, channel, time period and products to bring to your attention any anomalies or patterns in the data.  This is the “why”. 

There are many use cases for when businesses should turn to data analytics to improve decision making, these were just a few examples. We’ve been working with medium and large businesses since 2003 to help them make better use of their data to improve business performance. If you’d like to know more about how Inside Info can help, just reach out.

What Impact Is AI Having On Big Data Analytics In Australia?

What Impact is AI Having On Big Data Analytics In Australia

Australia’s leading companies need to have a better understanding of the rapid rise of Artificial Intelligence (AI) and what it means for their business. Over the last few years there has been a strong focus on big data, but there is not much awareness of AI among executive teams, apart from the general buzz. It’s important for CIO’s and other business leaders to understand the impact AI is having on big data analytics and their business as a whole, before they get left behind.   

Business intelligence (BI), also known as business analytics, is set to be transformed yet again as a result of big data and AI. As we continue into 2018, we’ll see the lines between business intelligence and artificial intelligence blurring even more. Thanks to the current capabilities of machine-learning systems that are capable of identifying patterns, habits and trends. Every board of a major ASX company is telling their CEO they’ve got to have a data analytics story and big data story, but what about an AI or machine learning story?

Many are already foreseeing big data to make a huge difference in the overall AI and machine learning landscape. In the annual Big Data Executive Survey conducted by NewVantage Partners this year, 88.5% of top executives surveyed were found saying that AI is going to be the most dominant factor that will have a disruptive impact on their companies.

Business Intelligence Evolves To Artificial Intelligence

To understand AI in ways that drive businesses, we must first start with something that business is familiar with - business intelligence or business analytics. BI software provides data and analysis to help business leaders make more informed decisions. The simplest BI systems are descriptive reporting engines that summarise business operations and tell you what has occurred. As data volume grows some BI software systems then incorporated predictive analytics.  This is using data to infer a likely outcome, such as forecasting the future trajectory of your data or the use of sentiment analysis - a kind of predictive analytics that analyses text data, such as social media conversations, and infers how the consumers feel about a product or a brand. Anyone who has ever shopped at Amazon or watched Netflix knows predictive analytics. These platforms recommend products or movies by optimising the similarity to our preferences. 

As BI applications and systems mature and become even more sophisticated they may also include prescriptive analytics, which not only forecasts potential future outcomes but prescribes specific sets or sequences of actions based on optimising some objectives. A common prescriptive analytics tool many of us use daily is a GPS, which prescribes routes to take us to our various destinations. This prescriptive analytics optimises an objective that measures the distance from your starting point to your destination, and prescribes the optimal route that has the shortest distance. 

Prescriptive analytics in advanced BI can recommend actions to optimise business processes, marketing effectiveness, ad targeting and many other business operations.  Regardless of what the analytics might suggest though, it is the human decision makers still who invariably make the final decisions on what to do. It’s artificial intelligence that then takes that next step.

Machine Intelligence Further Enhances Big Data Analytics

Big data analytics is not new in Australia. Companies such as Woolworths for example, invested millions into big data in a bid to better analyse the online and in-store spending habits of its consumers. Meanwhile, telecommunications giant Telstra has been building its analytics assets for over four years, and is using big data to drive improvements in its customer service among other things.

Today’s big data and parallel computing infrastructures which use graphics processing units (GPUs) have alleviated data and computing constraints around data volumes, processing power and the level of sophistication in predictive models. This has unleashed the creativity of data scientists and provided them with the freedom to use much more sophisticated models that form the basis of AI.

Simply put, the essence of AI is the automation of decisions from prescriptive analytics and the proper execution of all subsequent actions.

This requires AI to leverage real-time feedback loops from interconnected machines and databases that enable AI to learn from every experience and get smarter with every decision it makes.

Real-time feedback already exists in most prescriptive systems because it is closely related to the objectives that are being optimised. AI uses this constant stream of feedback data to feed its machine learning engine. This machine learning updates and improves our prescriptive analytics so the next prescribed decision is optimised even further to bring it closer to, or better than, what human experts would do. 

It is useful for companies to look at AI through the lens of business capabilities rather than technologies. Broadly speaking, AI can support three important business needs: automating business processes, gaining insight through big data analysis, and engaging with customers and employees.  Taking a closer look at gaining insight through data analysis, progress in machine intelligence has had a number of impacts on big data analytics, in particular:

  • Fueling further enhancements in big data indexing

  • Big data analysis can provide machines with a more meaningful and contextually relevant idea of their functions. For example, the automation infrastructure of a clothing manufacturing plant based in Australia that exports its products to Europe will be able to judge market requirements for the coming winter season in a more accurate and insightful manner if it is able to access and analyse big data reports about the market, financial and weather conditions of that area throughout the year.

  • Driving the need for greater interconnectivity and integration between machines and other data

  • Expanding opportunities to build and embed smart capabilities into your applications with open API’s.  Intelligent assistants can be deployed to answer questions in a conversational format or facilitate real-time collaboration with immersive analytics

  • Opening up new opportunities for users to fully explore many big, complex and varied data sets in a number of different ways than ever before.  Analytics insights can be conveyed with new forms such as voice processing and Natural Language Generation (NLG) such as automating analysis like Qlik Sense Narratives that update and communicate insights on visualisations in seconds

The AI & Big Data Landscape For Australian Business

The consensus seems to be that AI-driven automation will spur productivity and prosperity globally among business. The reason is automation is primarily designed to drive human productivity and not human redundancy. A survey by Avanade found that 31% of organisations have already started using intelligent automation to break through the productivity plateau, with the number set to double by 2020.  Moreover, 86% of respondents believe they must deploy intelligent automation to be a leader in their field. The problem with Australia is that we are already a fair way behind the rest of the world.

The recent report, The Automation Advantage, commissioned by Google and conducted by AlphaBeta, found automation presents a $2.2 trillion opportunity for the Australian economy and could potentially create millions of jobs. The report found Australia lags behind the rest of the world with only 9% of listed companies making sustained investments in automation, compared with more than 20% in the United States and nearly 14% in leading automation nations globally.

According to the report, if Australia accelerated its automation uptake it would stand to gain up to another $1 trillion over the next 15 years.

With this in mind, rapid advances in artificial intelligence will result in fundamental changes across the business landscape within the next few years, according to technology experts. Powered by sophisticated algorithms and with the ability to learn over time, AI will be increasingly used in everything from accounting and legal analysis tools to heavy machinery and autonomous cars.

In Australia businesses have been looking at technologies to transform a financial services company’s credit risk modelling, or an oil and gas company’s insight into their data. While the accounting and legal sectors are two that will experience significant disruption from AI in the short to medium term. Many tasks that previously have been undertaken by junior staff will readily be handled by AI. For example, the task of trawling through large quantities of case law to determine the likelihood of a new case succeeding could traditionally have occupied a team of young lawyers for days or even weeks. Such a task could be completed by an IT tool in just minutes.

Similar efficiency benefits will also be seen within accounting firms where many low-level, repetitive tasks can be handled by software rather than humans.

According to predictions by research firm Gartner, AI technology will be embedded in virtually every new business software product by 2020. The firm says that, by that time, AI will have become a top-five investment priority for more than 30% of all corporate CIO’s.

The following survey by Deloitte published recently in Harvard Business Review on Artificial Intelligence and The Real World found that of those executives familiar with their companies’ use of cognitive AI technologies, more than half said their primary goal was to make existing products better, followed by optimising internal business operations and freeing up workers to be more creative in automating tasks, followed closely by making better decisions.

In fact, The Automation Advantage report mentioned earlier cites that AI could lead to an 11% fall in workplace injuries, a 20% rise in wages for workers who are redeployed to non-automatable tasks, and an increase in job satisfaction for 62% of low-skill workers as they focus on more creative and interpersonal activities. A retail worker might spend nine hours less on physical and routine tasks like stocking shelves and processing goods at the checkout and nine hours more on tasks like helping customers to find what they want and providing them with advice. Teachers might spend less time entering exam scores and more time with students.

Conclusion

The consensus is that AI driven automation will stimulate productivity delivering better interactions and decision making in a variety of areas for Australian businesses.  As we progress to a future where AI has the potential to significantly boost the Australian economy and affect many areas of our lives, including opening more opportunities for big data analysis, it’s no surprise that heated debates around employment, security, public safety, rights of robots, regulation, and social and ethical considerations, are now bubbling to the surface. 

BI Trends For 2018: The Secret To Success In Analytics

BI Trends for 2018 with Qlik

Usually at this time of the year we’re inundated with trends to account for the rapidly changing Business Intelligence (BI) landscape and what this means for organisations moving into the start of a new year.  Qlik’s global market intelligence team have revealed what they believe are key BI trends that businesses should take note of, particularly with an emphasis on the “de-silofication of data”.  Qlik have identified 11 emerging BI trends, but let’s take a look at a few of them that can make it possible for businesses to operate at the next level. But first...

What Is Data De-Silofication?

Many companies have found their own way of connecting data, people and ideas.  What sets them apart is how they take these fragments of systems and data out of their silos (department, an individual, a location etc) and connect this data quickly in a governed way, to use this information to fuel smarter business decisions. So that said what technology or behavioural changes are facilitating this.

Trend 1: Data Literacy Will Gain Company-Wide Priority

Analysts like Gartner predict that companies will and need to, take a more structured approach to increasing data literacy across the entire organisation.  No longer just a focus for insights, finance and IT teams.  Gartner in fact predict that “by 2020 80% of organisations initiate deliberate competency development in the field of data literacy, acknowledging their extreme deficiency.”  In a data literacy survey that Qlik did in September 2017, nearly 50% of workers are struggling to differentiate between what the data is telling them.  But there’s an appetite for employees to learn here, as 65% said they would be willing to invest more time and energy into improving their data skillset given the chance.

Nearly 50% of workers are struggling to differentiate between what the data is telling them. 

Trend 2: Data Gets Edgy

Due to the increased number of use cases of data, especially around IoT, offline mobile and immersive analytics, we’ll see a dramatic increase in organisations running workloads locally on a variety of devices instead of through public data centres.  Gartner believe that by 2022, as a result of digital business projects, 75% of enterprise-generated data will be created and processed outside the traditional centralised data centre  or cloud, an increase from less than 10% generated today.

Trend 3: New Ways Of Data Cataloging

In 2018, new ways of cataloguing data will be more deeply integrated with the data preparation and analysis experience.  This will help bring it to a broader audience that is able to easily combine governed corporate data, data lakes and external data as a service.

Trend 4: The Need For Interoperability

Companies are looking for fit-for-purpose software systems rather than a single-stack approach.  So in saying this, analytics platforms need to be open and interoperable, with extensibility, embeddability and with modern APIs.  This will shift analytics to become more embedded within workflows.

Trend 5: Blockchain Hype Will Drive Applications Beyond Cryptocurrencies

New techniques are emerging for processing, managing and integrating distributed data, making the location of data an increasingly smaller factor in information strategies.  This means ideas can be inspired by blockchain and peer-to-peer technologies. Initially connectivity to the blockchain ledger will have benefits.  But ultimately, the value might lie in the ability to verify lineage and authenticity of data using blockchain technology.

Trend 6: Analytics Becomes Conversational

The use of analytics has traditionally been focused on drag-and-drop style dashboard list boxes and/or visualization. While there continues to be value in this, there are new approaches available called “conversational analytics”, simplifying the analysis, findings and storytelling so that users more easily get to that one critical data point.  This can include natural language query, processing and generation augmented by search and voice. This can be helped through virtual assistants and chatbots through API integration, provide a new means of interaction.

Trend 7: Augmented Intelligence Changes Users Into Facilitators

In its current state, the most effective use of Artificial Intelligence (AI) is applying it to a diverse but specific set of problems. But in 2018 and beyond, blending AI with technologies such as intelligent agents, bots, and automated activities, along with traditional analytical tools such as data sets, visualisation, dashboards, and reports will make data more useful. That alone, however, isn’t enough. Instead, a system where machine intelligence and humans participate in a broader ecosystem, and the exchange and learnings that happen between them, is known as augmented intelligence.

With all these trends, governance, security & data qualityare becoming more crucial initiatives in an increasingly challenging environment. But to thrive in the analytics economy, organisations need novel ways of doing that while also addressing progressively distributed environments. Leveraging a truly open platform with an ecosystem harnessing the latest emerging trends, technologies, and methods will bring together data, people, and ideas. This will lead to more data literate users, innovation, and augmented intelligence — helping to successfully integrate data into our lives.

To see the full list of the top 11 BI Trends for 2018 identified by Qlik, download the ebook below.

Download Ebook

Forrester Wave Report: It’s Not Your Old School BI Landscape Anymore

Forrester rate Qlik a Leader in Business Analytics

The key message from the recent Forrester Wave Q3 2017 Report for Enterprise BI Platforms With Majority On-Premises Deployments, is that you better be evolving your business analytics to keep up, as it’s no longer an old-school BI landscape.  Qlik was rated a Leader in the report by Forrester.

BI technologies have evolved at lightning speed over the last two years which has forced many analysts to re-group their BI segments when assessing vendors and their capabilities. Enterprise versus self-service and agile BI are now one in the same, as BI tools must be enterprise class, quick to change and deliver and be user-driven otherwise they fail to meet customer requirements. In addition, cloud and data visualization capabilities are considered mandatory for a leading BI toolset and are no longer considered separate segments by Forrester. 

In the most recent Forrester Wave Q3 2017 Report for Enterprise BI Platforms With Majority On-Premises Deployments Forrester provides detailed product evaluations highlighting key BI product differentiators if you’re assessing capabilities for your organisation.

Qlik was named a Leader in the report, with Forrester stating that, "Qlik continues to differentiate with its powerful associative BI engine" with its exploratory UI noted as "one reason customer references awarded Qlik one of the highest scores for business value in terms of ROI."  Simply put, all BI tools work great when you know how to ask a question and what specific data sources, tables and columns contain the information you’re looking for.  What if you don’t?  This is the sweet spot for Qlik’s two products, Qlik Sense and QlikView according to Forrester.

To find out more, you can download a complimentary copy of the Forrester Wave research report below.

Download Report

Using Analytics To Prepare For The Sink-or-Swim Future of Australian Media

Using Qlik analytics to prepare for the sink-or-swim future of Australian media

Data analytics and better use of business intelligence (BI) software has become a crucial strategic exercise for all companies, however making good use of data has never been so important for the media and entertainment industry (M&E) as the rapidly changing digital environment continues to alter customer expectations.  And getting it right, literally, does pay. Research has shown that companies in general who have invested in data analytics are reporting an increased competitive advantage, with a stronger focus on specialised, innovative applications that have strategic benefits according to MIT Sloan Management Reviews publication, Analytics A Source of Business Innovation.

The very act of consuming content provides incredible amounts of data that can inform every aspect of content generation, packaging and distribution. The challenge in media, then, is not to generate data, but to integrate multiple data flows—new digital data along with more traditional sources of information—into their operations. Media companies must seize the opportunities this new data presents—or watch their pure digital competitors extend their lead in consumer intimacy.

Our work with media companies across the value chain, including content creators, aggregators and distributors, leaves us with no doubt that the opportunity to serve audiences better is immense, and the companies that are able to capitalise on this opportunity are likely to produce tremendous new value. Here’s some tips on how to prepare for the future of Australian media using analytics, to remain relevant.

Single View of the Customer Across All Platforms

Sounds easy right, however many struggle with this.  With all the variety and wealth of data available to media companies, a big challenge is how to bring all this data together to improve decision making.  This means utilising a variety of data sources from social media, data aggregators like Nielsen, advertising response data, traditional enterprise operating systems and other means. If you're an entertainment company that has a physical presence in theatres, theme parks, cruise lines or retail, you'll also need to analyse customer traffic, staffing, supply chain and logistical information to provide an optimal customer experience while increasing value and revenue from your properties.  This means providing a consolidated view of performance across all operations.  The inbuilt connectors available with BI platforms like QlikView and Qlik Sense for example, make it easy to draw data from these multiple data sources. 

Revenue Growth Through Better Targeting

As media and entertainment companies broaden their content delivery platforms and offerings, they must understand how customers interact with each to fully see customer value and opportunities to up-sell and cross-sell. Knowing how customers change their preferences for certain platforms over time is important. Such an understanding also enables setting of justifiable rates for advertising across platforms and pricing for individual and combinations of platforms. Marketing offers and campaigns can be more accurately targeted. The value of the customer to the company can grow, even if they lose interest in certain delivery platforms, content, or other offerings over time.

We work with many of Australia’s leading TV networks to help them improve targeting and revenue growth.  To achieve this, media companies need to understand customers better, how they consume content and services, and what advertisements attract follow-on activities.  Media and entertainment companies can better establish the value of their brands and offerings leading to increased revenue from advertisers. They can also offer services and subscriptions to a potentially valuable customer database for the advertisers to mine themselves.

Using Analytics To Predict Bankable Assets

Qlik analytics can be used to predict whether current trends will continue and any possible implications or opportunities. In media, value comes from understanding and predicting the content (movies, video, music, books and games) audiences want. Data and analytics firepower can increase a media company’s odds of getting it right.

We’ve all heard the story of when the producers of House of Cards were shopping the series to various distributors, Netflix and the other networks bidding for it all knew that political dramas, David Fincher films and Kevin Spacey in a sinister role were highly bankable properties. But Netflix brought superior data to the bidding, based on its in-depth and fine-grained analysis of viewers’ habits over many millions of viewings of shows. Netflix executives not only knew these qualities were likely to make the show popular; they also knew how long viewers had stuck with similar programs, through seasons and individual shows, and which characters had drawn the strongest interest. That confidence allowed Netflix to make a bolder bid and win the show as well as three Emmy awards, despite the recent decision to drop the series.  

Qlik Self-Serve Business Intelligence Drives Operational Efficiency

By providing self-serve business intelligence as a differentiator, media companies provide access to relevant information to everyone who needs it from the sophisticated needs of the pricing and insights teams to client information, discounts and placements for the sales rep, to be competitive.   If not, media companies will increasingly find themselves outpaced by the better-informed, quicker business moves of those that excel in analytics.

Inside Info & Qlik In The Media & Entertainment Industry

More than 300 media providers worldwide are using Qlik to overcome their business intelligence challenges and improve performance. Qlik's Data Discovery BI approach enables media companies to glean maximum insight from data by enabling easy, flexible analysis. Analysis can be performed in real-time keeping up with instant platforms like social media. Its intuitive dashboards easily shift from lag indicators to predictive analysis encouraging collaboration across the enterprise. If you’d like to know more about how Inside Info can help, just reach out to us, we’d love to hear from you.

10 Trends for BI - Discover The Future of Data

10 Trends for BI - Discover The Future of Data With Qlik

Last year, we moved beyond the “big data” buzz and actually started to do something with it, as more and more data moved into the hands of users who don’t have a traditional background in business intelligence (BI).  Rather than relying on the experts, they sought out self-service business intelligence (BI) solutions, so they could make their own discoveries and drive data-driven business decisions. 
 
However, with the sheer amount of data constantly streaming in, it’s been hard for businesses to keep up with all the prep and analysis required to transform raw data into real insights.  Qlik has identified 10 trends in their new ebook that will drive better data literacy moving forward.  

1. Combining and associating data from disparate sources will lead to better insights.

Creating a single source of truth is critical but often difficult to do when trying to consolidate disparate data sources from across a dispersed business. Business intelligence software solutions are investing in providing better capabilities for enhanced data integration.  Combining both internal and external data sources into one single governed reference point. 

 In fact, 60% of the data that organisations consider mission critical will be external by 2020.  

2. Data Visualizations will extend beyond analysis to the full information supply chain.

In the past, data visualizations were generally used only to aid in the analysis of data. But moving forward, visualizations will be regularly used to add insight throughout the entire process of reading, working with, analysing, and making arguments with data. With more people (including non-experts) getting a better view of their data, particularly in areas that previously had little or no visibility, it will be that much easier to trust, understand and derive answers from that information – footholds on the path to greater data literacy.  

3. The adoption of cloud BI will reach its tipping point.

Cloud analytics is becoming the norm. According to Gartner in its 2017 Magic Quadrant for Business Intelligence and Analytics Platforms, 50% of companies will use some form of cloud-based BI in 2017.  Cloud analytics will make it easier for businesses to access enterprise-grade analytics from anywhere at a better TCO.  

4. New BI smart features will augment intelligence, letting people focus on their strengths.

Self-service analytics is becoming more sophisticated, incorporating advanced statistical models so that everyone can find insights, not just the data scientists who created the models. And, with the addition of machine learning, the non-data-experts can now speed time to insight even more. Features like automated data prep, smart pattern recognition, and auto-generated charts help take some of the burden off teams, so they can uncover answers faster and easier.

But these smart features are about augmented intelligence, not artificial intelligence. People – with their unique ability to think strategically, ask questions, and make non-linear connections – are still at the heart of the process; this technology simply allows us to focus on the sort of creative thinking and problem-solving we’re best at. Together, these new models and smart features will make the path to data literacy that much smoother.  

5.  Blending the digital & physical will open new worlds of data.

The growth of the Internet of Things (IoT), virtual reality, geospatial, and other connected device technologies means that huge new streams of data will soon be upon us. This data has the unique ability to help businesses better understand how these devices are used, and how they – and their users – interact with the physical world. But data analysts will both need to figure out what to do with the influx of new data coming from these emerging technologies. Pest control experts Rentokil, is an example of a business that has thought this through.  Rentokil use their connected devices and Qlik to analyse data from more than 20,000 devices to deliver higher levels of proactive risk management against the threat of pest infestation for their clients.

In addition, more consumers will soon be exposed to analytics – products like the Fitbit fitness tracker now offer web portals that provide users unprecedented access to their personal data, allowing them to first dip their toes into the world of data literacy. 

6. Freemium BI will allow more people to explore data

As competition in the analytics industry heats up, more vendors will be offering low-cost or “freemium” self-service BI solutions as a way to bring potential customers onto their platforms.  

7. Modern BI platforms will deliver self-service flexibility AND scalability not either/or.

In the past, companies that wanted analytics had a choice to make: They could either have a flexible solution, where users throughout the organisation could use data in any way that fit their needs; or they could have a scalable solution that was secured and controlled enough even for large enterprises to trust their data.  But now, with powerful modern BI platforms that combine self-service analytics with secure data governance, the tradeoff between flexibility and scalability will no longer be an issue.  

8. Embedded analytics will make data part of people’s everyday lives.

As data proliferates, organisations are eager to monetise and modernise their data assets by injecting outward-facing applications with reports, dashboards and self-service analytics. This type of embedded analytics can increase customer satisfaction and open up revenue streams, but in the not too distant future, will be a requirement for doing business. Read our previous article on understanding embedded analytics.  

9. No data analyst is an island - look to collaborative BI.

Businesses will need to invest in BI software solutions that create environments for their employees and external users to connect on their data, share learnings and insights. Making data accessible across the entire organisation also contributes to success, being a factor in 64 per cent of the high performing businesses surveyed by McKinsey recently. To achieve this level of collaboration, a platform for data analysis needs to be intuitive and easily accessed. In fact, Dresner's Collective Insights 2016 report found that 65 per cent of respondents see collaborative BI as a critical or very important priority for their businesses. This level of focus is yielding clear results for enterprises that embrace it.  

10. The future of BI is in providing more relevant data, to more people.

By democratising analytics, and better connecting people, data, and ideas, we’ll move that much closer to a culture that is more enlightened, more information-driven, and more fact- based. Qlik business intelligence has led in this regard, named a Leader in BI by Gartner for the last 7 years in its BI Magic Quadrant Reports. Qlik is an enterprise-grade platform designed for businesses of all sizes, is backed by a unique associative model, which allows teams to freely explore connections across all of their data at the speed of thought. Users (including non-data scientists) can delve into massive amounts of data, from multiple sources, quickly and easily probing possible relationships as they follow their own path to insight. And with self-service capabilities and unmatched governance, IT teams can finally give users the insights they need – without hassles or limitations. That’s why we’ve chosen to design and deliver Qlik business analytics solutions since 2003.  

To read more, download the ebook: 10 Trends for BI: Discover The Future of Data

Download ebook

HR Analytics Is Key To Mobilise Talent And Profitability

HR analytics is key to mobilise talent and profitability

We all know that people are vital to the success of any business. If a business can attract the right competencies, manage talent effectively, utilise capacity efficiently and retain employees, it’s setting itself up for long-term success. Senior management is increasingly interested in having concise, up-to-date information about employees and related external factors that can be used to make business decisions and mobilise talent as strategies change.

In a recent Economist Intelligence Unit survey of CEOs and CFOs, about one third of those surveyed said that the unavailability of data presented an obstacle to being able to measure the value of HR activities however.  In short, HR needs to capitalise on the vast amount of employee data available and deliver more actionable insight, more quickly, in the form of workforce analytics, in order to keep talent in step with business goals and strategies.

The Human Capital Institute Survey showed that 58% of executives said that having better insight into talent could improve profitability & 60% said it could increase revenue per employee.

This is where analytics can help HR quickly examine huge amounts of data to identify trends and patterns in employee behaviour and performance. HR can do much more than track basic performance indicators. It can understand the workforce in greater depth, find out what is happening and why it is happening, and determine the best way to move forward.

Using Qlik Analytics To Power HR Decisions

We’ve seen an increased demand among our clients recently looking for a better understanding of employee trends, labour productivity, benefits and recruitment data across their organisations.  We’ve been working with companies to provide this type of information in the form of improved HR analytics.  In particular providing dashboards & analytics software called Qlik that brings together data from payroll & other systems to understand attrition rates, retention, employee trends & demographic profiles, compensation by value band & how this varies across departments & other areas. 

When looking to analytics to power HR decision making, key questions to ask are:

  • Do we use analytics effectively to monitor HR performance & drive improvements?

  • Do we understand employees by type, value band & segment to better tailor HR services?

  • Can we look ahead to identify employees at risk of leaving or forecast team performance?

  • Are we using workforce data to provide a clear view of performance to management?

  • How can analytics help us be more proactive in workforce planning, model ‘what-if’ scenarios & identify areas for future improvement?

  • Do we have a consolidated view of all HR and other critical business data?

Qlik can deliver HR analytics in the cloud in a system that HR teams & managers can easily use & maintain themselves without having to rely on IT.  This provides a more cost-effective, on-demand solution that can be up and running in a few weeks. HR teams can gain insight into:

Workforce management:
  • Optimise employee management & succession planning
  • Analyse staffing resources & onboarding
  • Assess training & education offerings
  • Monitor productivity trends, staffing ratios & improve workplace relations
Total Rewards:
  • Control staffing efficiency, benefit offerings & labour costs
  • Analyse compensation vs performance
  • Enable benefit & payroll forecasting
  • Get a holistic view of total rewards from disparate sources
 Enhance Recruitment:
  • Improve organisational forecasting
  • Understand sources of recruitment better & what works
  • Use smart analytics to find better quality candidates
  • Analyse employee behaviour to reduce staff turnover

By providing this type of deeper insight into workforce performance, HR can demonstrate business value, equipped with integrated, strategic insights that can help you speed up decisions, reduce risk and empower management.

To find out more download this ebook on “7 Tales of Empowered HR” that gives examples of how others are leading in workforce analytics.  

Download ebook

Building A More Intelligent Manufacturing Enterprise

Manufacturing enterprises can benefit from BI solutions.

Australia's manufacturing industry has experienced great turbulence in recent years, facing intense competition from lower-cost offshore organisations, the closure of major facilities including Holden and Ford and a generally pessimistic edge to media coverage. It's a sector that has come under increased pressure since the global financial crisis - output has decreased by 13 per cent since 2008 according to The Australia Institute, with employment falling by a similar proportion.

Despite the seemingly gloomy outlook, however, manufacturing is still an incredibly significant part of our economy. Providing close to one million jobs and $100 billion per year in export revenues, it's a thriving industry brimming with innovation and enterprises facing up to immense challenges. 

Gaining an edge in manufacturing means adopting new processes and practices to keep pace with the competition. Business intelligence (BI) solutions are ideal for organisations seeking to improve agility and efficiency, utilising the insight of enterprise data to drive better decision-making, productivity and profitability.

The state of BI in manufacturing

Many industries have been quick to recognise the benefits of BI and data analytics, however, manufacturing enterprises appear to have been somewhat hesitant to dive in to the solutions.

Research by McKinsey in 2016 estimates that analytics tools have increased gross margins for manufacturers by up to 40%, with as much as 15% of after-sales costs also being reduced.

That said, McKinsey also found that the sector has thus far captured less than 30 per cent of the potential value highlighted by the firm five years earlier, and new developments have only made the playing field between early adopters and laggards less even.

Forbes' 2017 State of Cloud Business Intelligence report, meanwhile, reveals that almost 40 per cent of manufacturers surveyed still view BI applications as "not important", higher than any other industry examined. Given the benefits inherent in the solutions, it's concerning that so many enterprises are yet to grasp the potential for improving their operations.

Streamlining the supply chain with BI

In addition to all of the external challenges faced by manufacturers, internally there is an enormous amount of data that must be gathered, categorised and understood before valuable insight can be gleaned. Throughout the supply chain, analytics can be used to optimise production processes, ensuring manufacturers are capable of delivering on demand with minimal wastage. 

Manufacturing enterprises need to run as lean as possible to remain competitive, and many legacy processes and solutions may no longer be adequate. BI solutions provide organisations with impressive oversight of production efficiency, customer demand and product quality, allowing them to make amendments to operations with much greater agility. Predictive analytics simplifies the tactical decision-making process with three key areas of improvement:

  • Effectively balancing business objectives 

The supply chain is a multi-faceted element of the manufacturing sector, and while it's difficult - if not impossible - to get every part of the process in perfect alignment, BI tools can certainly make a positive difference. Analytics solutions can provide useful information on various business objectives, identifying when they are in conflict or running in harmony.

  • Gathering and contextualising data

Big data is defined by three key features - volume, velocity and variety. Making sense of vast amounts of information is never easy, but BI tools not only gather enterprise data into more useable repositories, they also contextualise it. Strategic analysis requires consistent, organised information, setting a strong foundation to move forward on data-driven initiatives like IoT.

  • Opening external data channels

External factors can place pressure on manufacturers, so having a solution that is capable of looking outside the walls of the enterprise is beneficial. Insight gleaned from social media, e-commerce and other sources may factor into the manufacturing supply chain, helping organisations gain greater understanding of customer demand and the performance of their products. 

Tapping into manufacturing enterprise data with Qlik

For Australia's manufacturing industry to grow in the future, technical innovation is essential. Analytics tools are a key part of that innovation, with the CSIRO noting that the solutions should be "applied across the value chain, including predictive maintenance, logistical tracking for operational efficiencies, quality control and service offering (when integrated into end product)."

Recognised for the seventh consecutive year as a leader in the 2017 Gartner Business Intelligence and Analytics Magic Quadrant Report, Qlik is an excellent choice for Australian manufacturers looking to improve their capability, efficiency and profitability. With the tremendous challenges these businesses face - pressure to innovate products and services, operate under tighter budgets and generate greater understanding of customers - enterprises can derive significant benefits from Qlik's visual analytics.

For more information on how Qlik can help your organisation drive operational efficiency and productivity, take a look at our video below. For more advice on the benefits of BI for manufacturers, get in touch with the team at Inside Info today.


Pages