Qlik Business Intelligence and Analytics

Using IoT Data to Drive Business Value

Digital transformation is reshaping businesses and industries in many ways. The Internet of Things (IoT) is a great example of this. There's a lot of talk lately about IoT data, but this tends to focus more on what's used to capture the data - such as wearables, sensors, iBeacons, and other network-connected machines. Gartner believe that by 2020 there will be 25 billion connected things with adoption across all industry sectors, while data will double every two years due to the vast amount of data created by IoT.  However, the real value of the Internet of Things goes beyond connected devices. The greatest value for organisations comes from combining the data generated by these devices with other customer or operational data to uncover insights and establish predictive models. This is where business intelligence platforms like Qlik, come to the fore.  This is the exciting promise of IoT, but without the ability to link data from the smart, networked “things” with other business data, its value is limited.

So how would a business use IoT data?

IoT technology has many potential applications for businesses.  For example, package delivery trucks, manufacturing systems and electrical grids all typically have sensors to monitor performance. Retailers can combine data gathered from in-store iBeacons with customer transaction histories and store behavioural models to determine the best promotion to send or other actions to take, such as notifying the store staff that a VIP has arrived.  More and more companies are now starting to collect and store data from such sensors. The next step is to analyse the data. Looking for patterns in the data could illuminate ways to improve business operations, such as doing more preventive maintenance or designing more efficient delivery routes. 

Collecting and analysing data from the Internet of Things is different from doing it in mobile and web enterprise systems – because the data isn’t located in resource-rich data centres. Instead, it’s out there in the real world. IoT data usually consists of custom log files, is sometimes misnamed, and appears unstructured. In fact, IoT data has structure, but it isn’t in a traditional relational or other standard format. The log file structures and included data points vary from manufacturer to manufacturer, model to model, software version to software version or even company to company. This introduces complexity when interpreting the data and trying to format, normalise, and combine it with other relevant data for analysis or operational systems. Without tools like Qlik to help interpret IoT data, the time and effort to put the IoT data to work is costly, time consuming, and prone to manual error.

What does IoT mean for the CIO?

The IoT will create unprecedented opportunities and challenges for every CIO in every industry. Three main things that have changed in recent years are accelerating the number and value of connected things:

  • The cost of connectivity and embedded technology is no longer a barrier to adoption with broadband, Wi-Fi, Near Field Communication (NFC), Bluetooth and mobile networks now able to support large volumes of IoT connectivity at little incremental cost.
  • The IoT's complexity and intelligence are evolving to support an ever-broadening range of use cases.
  • The provision of information via sensors and the resulting analytical opportunities and context-setting are transforming how we look at the world and at ourselves. Data is inherent within the operations of things, making them a rich source of further insight. Through analysis, the data collected from things can turn into information. The information captured and distributed by the IoT is a key source for the new digital strategies.

How to realise business value from IoT data?

Gartner research into the IoT in April last year showed that 29% of organisations have already implemented the IoT, and that another 14% are planning to implement the IoT in 2016. This indicates that the technology will be solidly in early mainstream business adoption by 2017. The first step is to move the conversation from talking about IoT, to talking about what IoT can do, or be, specific to your organisation. Organisations also need to look at IoT in conjunction with other technologies. In order to fully realise the value of combining IoT data and other enterprise data in an agile way, organisations must leverage modern business analytics tools to accelerate and automate the processes. Using tools to profile data, intelligently discover its structure, and then automatically parse and combine it with other relevant enterprise data on an ongoing basis makes the IoT data more accessible. This creates an infrastructure for ongoing expansion and evolution in the use of IoT data to understand customers and create predictive models for operational systems.

The shift now is toward externally focused benefits with IoT with improving customer experience as the hottest, most rapidly growing and most common benefit being pursued.  The IoT is increasingly becoming a competitive weapon in the marketplace. IoT is lowering costs, increasing functionality, and addressing issues in usability, interoperability and openness. Usability is not just for end-users, but also extends to developers building solutions.

There are many best practice use cases for using IoT data already, here are some examples:

  • Retail Store Beacons - If customers have opted-in on their mobile devices, then beacons in branch retail stores can greet the customers when they arrive, keep track of loyalty points, push recommendations based on customers' purchase history as well as current interactions, and enable customers to pay through their mobile devices. Target in the USA is doing just that. Amazon Go  and it's no lines, no checkout concept is another example here.
  • Preventative Diagnostic Care Monitoring & Smart Medication - In healthcare connected devices can transmit patient conditions and information to healthcare providers to promote self-care and detect problems early, thereby reducing doctor visits. While smart pill bottles combine sensors with mobile technology to alert patients to take medication, and notify healthcare providers if bottles are not opened. Phone calls or text messages alert patients as an additional reminder for improved patient compliance. Smart pills with embedded microsensors connect to patient skin patches to track ingestion and gather health data for patients and physicians.
  • Digital Oil field management - Austral Pacific Energy are using down-hole sensor data to populate distributed control systems to manage the oil extraction process for assets that are difficult to recover, such as waxy petroleum, which requires heat injection.
  • Smart irrigation - Councils and agriculatural companies are looking at smart irrigation for urban parks or crops that can be centrally controlled using ground sensors to indicate if and when irrigation is needed, thereby saving water.  Stirling in Australia are a case in point here. 
  • Pre-emptive maintenance - Manufacturing companies and energy providers are using sensors on industrial equipment to gather operational data for analysis to predict and prevent failure, and to support improved maintenance. Read our article on using analytics for pre-emptive asset management in the oil and gas industry.
  • Asset optimisation - Real-time data collection from industrial assets, such as refrigeration systems, to assess operational performance and improve efficiency. It is used in oil and gas, utilities, manufacturing, refrigeration, and power distribution industries.

If you have the data and the detail, you need to understand how your data is associated or related.  If the sensors in your supply chain indicates a shipment is going to be late, aren’t you going to want to let your customer know the shipment to the store will be delayed?  Qlik offers a platform that provides the ability to pull data from multiple sources, at a detailed level, and its core technology associates the data providing a roadmap to discoveries for the business user at head office or out in the field.  This level of data visualisation will be crucial as companies continue to digitise and extend to IoT services.

In early adoption phases it is easy to spend significant time and money on trials and deployments that produce little to no value. Estimating the strategic value of IoT use cases can help CIOs avoid wasting resources on unproductive use cases, or avoid forming partnerships that don't deliver results. 

Using Analytics To Improve Asset Management In The Power Industry

Power companies need to get plugged in to better data analysis tools.

Due to the complexity and increasing challenges of delivering gas, water, electricity and waste management services to their customers, utilities need management systems that provide all employees including those at the grass-roots, with access to wide ranging data sources in a simple to use, consolidated way to improve decisions about suppliers, assets, risks and operations.

The high cost of infrastructure within the utilities sector, dictates effective management of assets to optimise efficiency, safety and minimise downtime. However, many are still struggling with uncertainties and the road to 'data-driven' asset management. Maintenance programs tend to vary across companies but effectively leveraging business analytics to approach asset management can yield significant benefits.

Data-Driven Asset Management

Sensors and data from other hardware that allow assets to be tracked and controlled remotely have become more mainstream within the industry.  Accessing, processing and interpreting this data is made simple with business intelligence platforms like Qlik. Energy providers don't need to rely on the old model of sourcing specialists to set maintenance schedules, instead they can use real-time performance data to guide asset management decisions. Schedule-based maintenance must give way to a more data-driven approach so that the asset and engineering base responds to needs as they emerge.

Companies that want to lower costs might use analytics to increase the reliability of their services or identify routine procedures they can eliminate, particularly for assets that are less valuable, and to keep their assets in service for longer. Analytics can also aid in planning additional maintenance work for assets that can disable their networks if they fail. In the area of asset management, we usually find that most utilities tend to use analytics to:

  • More effectively measure asset health and provide indicators on the likelihood that the assets may fail (usually incorporating test data, performance failures and even data on weather conditions).
  • Measure the importance of asset availability for those that rely on them (eg. Customers, suppliers etc)
  • Provide guidance on asset maintenance and replacement across a plant, transmission or distribution network.

Using analytics to support asset management only works if companies can produce high-quality data on its assets. At many utilities however, data quality can vary, and consolidating the right data can be difficult. This is because companies often divide responsibilities for assets among departments that have their own IT systems. This data needs to be integrated so all the asset data can be consolidated for users on the front end.  A single feed into a data warehouse does this or advanced BI platforms like Qlik can also go direct to data often removing the need for a data warehouse.

How Qlik Analytics Optimises Assets & People

Smart asset management with Qlik enables maintenance to be shifted from a time-driven exercise to a proactive exercise for the first time. Machinery, parts and equipment are repaired when they need to be repaired rather than simply using the calendar as a prompt for assessment. By pre-empting and preventing breakdowns, organisations can reduce the cost of outages, avoid subsequent penalties and exceed customer expectations.

Moreover, by tracking plant, construction materials and assets across a project's lifecycle, organisations have end-to-end traceability from onsite delivery through to in-life operations. This allows project costs to be better controlled with accurate information about available equipment and resources.

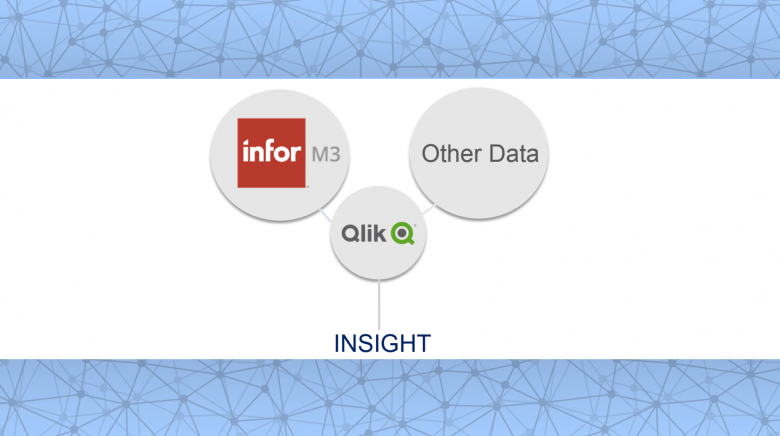
Using the Qlik Business Discovery platform an energy provider can easily combine data from disparate systems into a single dashboard to suit the needs of many different users. In essence providing:

  • A full 360 degree view of assets: current operating condition, work order status; reliability - uptime, downtime and Mean Time To Failure (MTTF); the current location of assets, spare parts or skilled engineers
  • Improved maintenance scheduling and uptime directly improving the wider operational goals of the enterprise
  • A single common application can be used to analyse a wide variety of assets dispersed globally by any user creating a single version of the truth
  • The App can be updated automatically daily, releasing valuable departmental time for in depth analysis, rather than assembling reports
  • Typical return on initial investment can be achieved within 3 months

So let's look at an example. One of our energy clients undertook an operational and reporting project to improve its capability and provide grass roots staff with timely and relevant data to make decisions.  Inside Info worked with them to develop Qlik business intelligence applications to provide self-serve dashboard style information access for, Plant Maintenance (both maintenance and cost performance), Occupational Health and Safety (incident statistics and tracking) , and Finance (Inside Info assisting in the development of a financial dashboard).  All of the applications integrating seamlessly with financial and operational systems.

The plant maintenance dashboard helps the business to measure both maintenance performance in both the corrective and preventive areas as well as maintenance cost performance.  This improved visibility and measurement against predefined targets facilitates improved decision making designed to improve plant performance and reduce costs.  The health and safety analysis dashboard provides visibility at all levels of the organisation, safety performance tracking to budget lost time, injury rates and incidents.  While the finance dashboard provides the finance teams with a view of the organisations' financial situation and provides interactive profit and loss drilling down into revenue items and operating costs at any summarised or transactional level.

Qlik was chosen for the fact that it is an easy to implement, highly visual, easy to use business analytics platform that provides business managers and analysts with access to the data they need to better monitor maintenance, OH&S and finance performance. Qlik is ideal for companies who want to deliver consolidated, interactive analysis of data to the business in a simple, self-serve way.

Enhance Infor M3's Capabilities with Qlik BI Software

Our Inside Infor M3 Dashboard can help leverage your business data.

Many organisations have invested in Infor M3 ERP systems - previously known as Lawson - to streamline financial and operational processes across their businesses. While Infor M3 is recognised as best-in-class, it can sometimes struggle with business intelligence (BI) - especially when integrating with non-Lawson third-party systems. We frequently hear Infor M3 users talk about the difficulty of accessing and analysing their M3 data with or without in-built BI systems, with reports that only take users part-way to the insights they need.

Built for centralised reporting, Infor M3 and most add-on BI tools lack the flexibility to meet new reporting and analysis demands. This is especially true when requirements include combining M3 data with information from other sources and when large data volumes cripple performance. The inherent complexities, lack of speed and usability, and time-intensive nature of these approaches for reporting, hinders executives and analysts from improving decision-making and business performance. As a result, M3 users can often lack visibility into their business processes and critical insights that remain hidden away inside the system.  

Inside Info's Director and Qlik Managing Consultant, Phil Langdale, is speaking at the Infor M3 Users Network (IMUN) annual conference, held on the Gold Coast on 17-19 May 2017, about how to use analytics to reshape the entire organisation for those running Infor M3. In particular, Phil will discuss how many of our other clients who are running Infor M3 are using the leading Qlik business intelligence platform to transform operations and deliver interactive, on-demand analysis and dashboards for Infor M3 and other data, delivered in just a few weeks.

Rethinking Information Needs

The growing need for broader data literacy among executives and business teams requires a rethink of how information needs are addressed within organisations. For those businesses running Infor M3, that means rethinking how to better leverage M3 and other data to provide self-service intuitive dashboards and analytics that engage all types of users - from executives to analysts and operational team members. When used correctly, key insights can be delivered quickly and provide a consolidated, consistent view of performance across the enterprise for more effective, agile decision making.

The Inside Infor M3 BI Dashboard

In particular, our experiences with Infor M3/Lawson have allowed us to develop the Inside Infor M3 Dashboard - a proven, best-practice business application developed by our senior consultants. Already used by firms like GWA and Manassen Foods, the solution delivers extraordinarily sophisticated interactive analysis and a consolidated view of performance, through analysis that is highly visual and affordable, and quick and easy to deploy, use and change.

"When I first saw what Inside Info could do with Qlik and our data, I was immediately impressed. Qlik provides our brand, sales, management and operational teams with complete transparency," says Wayne McIntosh, Finance Director, Manassen Foods.

The Inside Infor M3 Dashboard significantly fast tracks BI projects and increases user adoption by leveraging off the learnings of others, with customers typically up and running in about 30 days. This dashboard - based on the Qlik business intelligence platform, provides a:

  • One-screen view of all the facts: Consolidating data from Infor M3 and other sources to ensure cross-functional visibility, providing a clear view of sales, inventory, service levels, customers, financial and other operational performance. A number of filters allow you to understand key measures against budget over any time period, and conduct comparative analysis. Additionally, the solution allows linking of transactional processes, dramatically improving business strategies and uncovering opportunities.
  • Consolidated view across multiple businesses and divisions: The dashboard provides a single view of financial and operational performance across companies within a group or individual business areas - often difficult to achieve with other BI tools given multiple and varied data sources - and drill-down access to any area of the business. 
  • Near real-time visibility into operations: Instead of out-of-date reports, the dashboard offers on-demand self-serve analysis of data, often replacing hundreds of OLAP-based reports and empowering users to perform their own analysis, reducing IT support by up to 90 per cent. Users report 54% less time accessing information and 51% less time analysing it, according to IDC.
  • Rapid response times: Sub-second query response on very large data volumes - into the hundreds of million records - without losing transactional level detail, with data refreshing as often as your underlying source systems.
  • Comprehensive views with granular detail: Ability to view information at a detailed, transactional-level, and anywhere in between in any path decided by the user, with no pre-defined drill-down paths. If you've got a business question, odds are you'll be able to answer it without having to wait for another report. Easy consolidation of data from any and multiple data sources.
  • Simple to use, available everywhere: Access your dashboard from any device - whether this be laptop, tablet, a web browser or your mobile device, with HTML5 compliance ensuring a consistent experience on each.
  • Very fast implementation cycles:  A typical project lasts 30 days and is 53 per cent of the total cost of other BI solutions, according to IDC. Meanwhile, adding in a new data source or building a new view of the data can be modified very easily within a few hours.

To understand more about how Inside Info can help organisations make the most of their Infor M3 and other data, check out this Manassen Foods case study below.

Download Case Study

What Makes Qlik Unique Among Business Analytics Platforms?

What Makes Qlik Unique Among Business Analytics Platforms?

For companies seeking business intelligence solutions that will transform the way they oversee their operations, there's no shortage of options. BI tools are designed to deliver timely insights through smart analytics that improves decision making across the organisation, and therefore business performance.

Qlik, however, is unique among BI solutions in revealing the whole story that lives within your data. It's no longer just about poring over numbers and compiling reports - the average solution can do that, but modern BI demands more insights at a greater velocity. Here's some thoughts on why and how Qlik can take your business to the next level.

Making intelligent decisions quickly

Perhaps the most significant factor that differentiates Qlik software is its ability to help companies make big decisions quickly and confidently. There's no doubt that any BI solution can help with making decisions, but at what speed? Our research has found that 42% of professionals need to make their data-driven decisions within one day, yet it takes six weeks on average to build a report using traditional BI.

Closing this gap is essential. In an increasingly digital world, working with data quickly and efficiently is crucial for companies to gain a competitive advantage.

Qlik serves as a way to eliminate this issue. The solution helps bring people together to make collaborative decisions faster. It's built upon the idea that people make decisions, not applications.

Powerful new technology at the core

So what makes it possible for a BI solution to foster better decisions and collaboration when it comes to analytics? With Qlik, the answer is centred around its QIX engine – a patented, in-memory, associative data indexing engine.

The QIX engine is built for speed-of-thought response, which means it reads data quickly and instantly finding associations that will inform future decision-making. It makes inferences and uses them on the fly to recalculate all the analytics in your app and put them in current context.

With each click, it instantly determines the associations in your data, highlights your selections in green, associated values in white, and unrelated values in grey. This gives you a complete view of all your data, tearing down any arbitrary boundaries and ensuring that no relevant information is left behind. What's more, this all happens at the speed of thought with no interruptions. There's no need to predefine data hierarchies, you're able to freely analyse even the largest data sets.

Adapting with the evolution of your business

No business should be content simply to stay in one place, never evolving or growing. If your organisation is always looking to make improvements, you'll need to have an adaptable BI platform that grows with your business, making improvements to fit your company's ever-changing needs.

Qlik, like no other BI software, connects all your people, data and ideas.

Qlik is a modern, enterprise grade business intelligence platform. A platform that enables your organisation to fully leverage the power of analytics. This includes:

  • An enterprise BI solution - custom and pre-built apps, guided analytics, and self-service discovery and visualisations, embedded analytics, collaboration and reporting with Qlik Sense and QlikView that connects to any and multiple data source and is available any way you wish to deploy them.
  • An innovative association engine to freely probe all the possible associations in your data across all data sources to answer "What happened?", "Why?" and "What's likely to happen?"
  • A strong data governance and security layer that unifies data creating a single source of consistent, reliable truth to act upon. Qlik's data governance capabilities provide shared, reusable libraries of dimensions, measures and visualizations, governed streams of content, rule-based security and access profiles down to the row and column level. Centralised management allows IT to manage the platform and safely scale Qlik to thousands of users across your business.

The best companies are built on a premise of agility and trust. Your processes must always be evolving, and you also need to trust that your BI strategies are adapting to meet your changing needs. With Qlik, both of those elements fall seamlessly into place. Download this ebook on What Makes Qlik Unique for more info.

Download Ebook

4 Tips To Create Data-Driven Dashboards That Add Value

4 Tips To Create Data-Driven Dashboards That Add Value

Depending on the role, different people in a company typically have different reporting and analytics needs. Whether you’re building a business intelligence dashboard  for the executive team or an operational team, do your dashboards tell the story you want to get across or does the insight get lost in a sea of KPI’s?  Here are a few tips to keep in mind when designing and building great dashboards. 

1. What story are you telling?

As with any communication, the first golden rule is to understand who it is you’re trying to persuade, inform and engage with your dashboard.  Once you understand this group and how they consume different types of information, storytelling then becomes an important skill.  Humans have long been engaged in storytelling, it’s one of the cornerstones of communication. In fact, stories are remembered up to 22 times more than facts alone. With that in mind, taking a structured narrative approach to your business data can help make it more understandable, memorable and persuasive.

By assembling your data into a story, it creates cohesiveness and structure for presenting that data. The most engaging stories are conversations, giving listeners room to ask questions, just like an interactive data visualization.  So being able to share your insight with others is a priority. Dresner’s Collective Insights Report last year found that collaborative BI has become a necessity while Aberdeen found it also can drive an impressive 18% more revenue growth in organisations.  Our article on how to foster a collaborative analytics environment explores this further.

Qlik Sense’s unique data storytelling capability fosters collaborative business intelligence allowing you to move seamlessly between presentation mode and the original data set to answer questions on the fly, while its powerful visualisations support the narrative. 

2. Choosing and displaying the right metrics

Excess information, confusing graphics and unnecessary features can make a dashboard difficult to use and understand. You should “remove everything you can and nothing else”.  If you have only one minute before a dashboard must be completed, ask yourself what to remove—not what’s missing. This will give you a good feel to what should be included in the application. Always remember to take it back to your audience and who are the main users of the dashboard and the metrics they want to be able to view easily and quickly. Smart search capabilities built into the dashboard can also connect the dots between data making it easier to find answers.

By incorporating data visualizations into your dashboards complex data can become clearer to see trends and correlations that aren’t visible in rows and columns. There are some guidelines however to best practice.  Be careful not to overdo your use of colour, while universal colours like red and green if used should convey good or bad performance in graphs. Keep your dashboard design simple by limiting the number of KPI’s in a dashboard to 9 or less and avoid visual clutter.   Choose the right chart for the right purpose.  For example, pie charts are good for comparing parts of a whole on a limited data set, while scatter plots are great for analysing product performance or margins to see any outliers that need attention.

Qlik’s simple drag-and-drop interface and smart visualizations use new techniques that make it easy to convey meaning in data.  Each chart is fully interactive, one click from summarised to transactional level detail, while visualizations dynamically update to changes made anywhere in the app.  Each chart is also a responsive design, automatically adjusting to screen size and mobile touch.

Incorporating mapping and location intelligence may be important for certain dashboards if looking at different channels, suppliers, client or product dispersion.  It becomes another tool to display and navigate insights.  If this is important, check out Dresner’s new study on location intelligence.

Remember design is not just what it looks like and feels like.  Design is how it works.

3. Responsive Design & easy to manage

A good dashboard isn’t a one-size-fits-all approach.  That means, if delivering a dashboard for a mobile deployment is required, the BI software needs to be smart enough to automatically re-render its design to best fit the deployment. If not, it becomes a costly exercise in building the same dashboard for a server deployment, then a mobile deployment, as simply shrinking a desktop version of a dashboard to an Ipad isn’t a great user experience in terms of functionality and form. So look for business intelligence platforms that can provide access on any device, anytime, automatically adapting to the device, being  HTML5 compliant.

Ensuring the dashboard is easy to use is a given, but being easy to manage is also important.  There needs to be strong data governance built behind each dashboard, so everyone is still working from a single version of the truth.  This may take the form of inbuilt security or leveraging governed data libraries of data models, applications, data definitions and data stores.  This ensures scalability as your organisation grows, especially if leveraging self-service BI applications. 

4. Automate Data Integration & Consolidation

According to IDC the average employee spends over six hours each week on data-gathering, compared to just over four hours on consolidation and analysis. Minimising this time by making it easy for employees to access relevant data in a timely manner must be a priority for firms looking to maximise productivity & reduce unnecessary costs.  Because data collection has traditionally been a manual process, even when traditional BI tools are in play, it has been both slow and labour intensive. System and data integration are often cited as the main limitations of current BI systems or processes.

However, sophisticated BI tools like Qlik Sense software have upended this paradigm, providing point-and-click data integration from any and multiple data sources, while business users have the option to create their own powerful dashboards and analysis simply on the fly - or to use guided dashboards created by IT. Each, however, allows for full, drill-down capability from a summarised view of data to transactional level detail, quickly and easily on a consolidated view of data across the enterprise.

The value of self-service analytics over outsourced methods cannot be overstated. Forbes found that close to 90% of industry leaders - more inclined to use this distributed BI framework - report seeing significant business benefits from their BI software. This is in stark contrast to organisations overall, where only 53% have the same positive view.

If you want to know more about Qlik and how it can help you create simple, intuitive and powerful dashboards, view the ebook below.

Download Ebook

Using Data To Maximise B2B Sales

Using Data To Maximise B2B Sales

How costly is poor prospect or opportunity qualification to your business?  Too often than not in business-to-business (B2B) sales a vast amount of time is spent on prospects and deals that result in zero return. This is where sales and marketing analytics and better business intelligence become increasingly important - essential to unlocking insights, increasing revenue, profitability and brand perception.

Unlocking the power of sales data

Typically lead generation and researching accounts consume about one day a week for a sales rep. So it stands to reason that if reps are spending more time researching and trying to understand accounts, they have less time to sell and focus in on converting and upselling quality prospects or clients. Identifying opportunities early that are a good fit through business analytics, is key to increasing sales productivity and business results. According to research from McKinsey&Company business analytics is a key driver of organisational growth.

McKinsey looked at two distinct groups of enterprises - fast growers and slow growers - and found that the fast growing sales organisations use analytics more effectively than most, with 53% heavily investing in sales analytics, compared to only 37% of organisations categorised as slow growers. Sales analytics is a proven weapon for differentiating organisations from the "also-rans" in their industries.

Companies have been using sales data in recent years for:

  • Radically improving lead generation
  • Matching customers with the right proposition and salespeople
  • Reducing churn and maximising customer value
  • Setting price points optimally on a rolling basis

All of the above are easier to do with data than by relying only on gut instinct. Given their potential to add real value to the business, they're more than worth the investment required.

Sales analytics must be intuitive

It is important to organise and present data based on the perspectives the organisation decides to emphasise. For example, one organisation we work with had always led with information on sales rep performance first. Strategically, they decided they wanted the reps to first look at information from the customer perspective – information on what is happening in their territory and with their customers. So they organised data views on a sales rep dashboard to show specific KPIs on their customer – such as ranking customers based on sales or the number of face-to-face meetings that have occurred.

In a competitive environment, a sales rep being better prepared and informed on what is going on with the client can be the make or break in winning a deal and extending a relationship. Here are some other key considerations in using data to maximise B2B sales:

  • Make dashboards and analytics visually engaging; this will help drive adoption. All people, in particular salespeople, like something that looks fresh and new. GeoAnalytics and mapping are useful tools here.
  • Keep it simple. Sales teams are not data scientists, and people within sales teams change regularly. Analytics needs to be simple enough for the average salesperson to pick up without lots of training.
  • Training should focus mainly on what behaviours and actions the sales leaders want from the reps in using the analytics. What are we going to do differently now that we have this information?
  • Ensure the right amount of information is provided – just enough for reps to do their job and make the decisions, and no more. This includes all performance information in the one place from multiple sources (e.g. sales, CRM, market share), creating a single view of the customer.
  • Consider the device they use and tailor the information to that device; for example, if sales reps use iPads, design the analytics on an iPad.
  • With these capabilities in place, you'll have the foundation to serve up relevant, pertinent, and actionable information to management and your reps.  This will increase the number of higher priority opportunities on which become focus, decreasing the time spent sourcing information and increasing sales rep selling time, close rates and performance.

For more information on providing sales teams with relevant information to do a better job, download this complimentary report.

Download Report

The Latest Trends In Business Intelligence, From Gartner's BI Magic Quadrant Report

The Latest Trends In Business Intelligence, From Gartner's BI Magic Quadrant Report

Gartner just released the 2017 edition of its Business Intelligence and Analytics Platforms Magic Quadrant Report, a rundown of the industry that's eagerly anticipated each year by insiders in business intelligence.

As we mentioned in our earlier blog post about the 2017 Gartner BI Magic Quadrant, Qlik was named an industry leader for a record-breaking seventh consecutive year this year due to its above average customer experience, robust product range and strong partner network. Qlik Sense is the fastest growing BI product in the market, and for good reason. The solution had a very strong 2016, beating revenue expectations with strong customer growth. Moreover, it's plain to see that Qlik's move to a private company has helped drive more investment into product development and innovation.

But the release of the Magic Quadrant also gives us a chance to look more broadly at the marketplace for business intelligence and analytics. The report also highlights key trends within the business intelligence and analytics market and what businesses should consider when looking to invest within these areas.

Modern BI will continue to dominate

The increased need for data governance within enterprises will continue to drive the need for IT involvement in user-led BI deployments. As BI engagements continue to grow in terms of number of users, data complexity and use cases this will ensure that self-service BI platforms must also provide strong data governance layers. According to Gartner modern BI tools that can support greater accessibility, agility and analytical insight while also maintaining ease of use (but at enterprise scale and trust for complex and large datasets) will drive and dominate new buying. While embedding analytics within applications will continue to enhance services to customers, users and clients and be a key enabler of more pervasive adoption of, and value from, analytics.

Smart data discovery and advanced analytics

It's well acknowledged that Qlik pioneered Data Discovery BI - user-driven, self-serve analysis of data that is easy to use, easy to change and can be delivered quickly. Gartner talk about this concept evolving even further to develop advanced analytics and further insight for business users. So how does Qlik handle this? Qlik's engine works as people think, it intuitively seeks to understand all the possible associations that exist in user's data, across all their data sources and allows them to freely explore that data, asking questions in any direction without restrictions or boundaries. That means no predefining data hierarchies or building data cubes. In short it facilitates what many investments in neural networks are striving to achieve. Qlik enables a unique search experience, associative data prep and profiling, data enrichments, suggestions, labeling, compression, truly smart and adaptive visualisation, and indexing across big data sources. In short it defines 'smart' from data preparation, to finding patterns in data, to sharing and operationalising findings.

Moving towards an AI-powered future

We've already seen a lot of growth in the BI market, but what's coming next might be truly groundbreaking - in the near future, business might be powered largely by artificial intelligence (AI). In fact, Gartner anticipates that by 2020, 90 per cent of BI platforms will be powered by such features as natural language generation and AI.  Gartner refers to this movement as a "modern wave of disruption," and it's coming slowly but surely.

To read more about Gartner's report, download a complimentary version of Gartner's 2017 Business Intelligence and Analytics Platforms Magic Quadrant below.

Download Gartner Report

Qlik Rated #1 for Location Intelligence Capabilities in new Dresner Market Study

Qlik Rated #1 for Location Intelligence Capabilities in new Dresner Market Study

Dresner’s 2017 Location Intelligence Market Study, part of the Wisdom of Crowds® series of research has rated Qlik #1. The Market Study examines the nature of location intelligence and business analytics, exploring user sentiment and perceptions, the nature of current implementations, and plans for the future. To download the full Dresner Location Intelligence Market Study click here

According to Howard Dresner, founder and Chief Research Officer of Dresner Advisory Services, “we’re in the midst of a profound shift. The impact of location intelligence is clear and organisations should be thinking about how it can be exploited or expanded to improve customer relationships, markets, assets, and more.” With the growth in visualisation and the emergence of Internet of Things (loT), location as a key dimension and maps as a means of displaying and navigating insights have become increasingly important. More than half of respondents in the study consider location intelligence “critical” or “very important.”

Among 30 topics evaluated, location intelligence ranks 20th, below traditional topics but ahead of “hot” topics including big data and loT. “Location intelligence is becoming mainstream and there’s a powerful opportunity to take what’s unqiue and compelling about it and bring it to life in an easy, fast, and flexible visual analytics platform,” said Anthony Deighton, Qlik CTO and SVP of Products. “We see ourselves as the leader in this space and will continue to make bold moves in building a modern, cloud-ready platform that can grow with customers on their analytics journey.”

Qlik Delivers Advanced GeoAnalytics

Location data can often be difficult to analyse due to the complexity of geospatial information. Qlik’s GeoAnalytics™ will not only ease this challenge for Qlik users, by providing clear and immediate access to intuitive and state-of-the-art location-based analytics and map visualisations, but further enhance the already leading Qlik business intelligence platform

Qlik GeoAnalytics™ will allow users to analyse, not just visualise, geographical information alongside non-geographical data in an easy to use way. Qlik Sense and QlikView customers now have the ability to explose hidden geographical relationships, offering greater insight, better decisions, and higher ROI. In essence providing:

  • A much richer mapping capability alongside Qlik's existing mapping functionality

  • The ability to easily add a vast array of maps to Qlik apps with automatic geo-data lookup to reveal crucial spatial information & then overlay with different visualisations in drill downs

  • A way to display thousands of objects with high performance - determine potential store locations, understand customer distribution of sales by postcode, or calculate supply chain delivery times

  • Insight into patterns not easily interpreted through tables and charts

To download the full Dresner Location Intelligence Report click below.

Download Report

Why Qlik Is A Leader In Gartner's Business Intelligence & Analytics Magic Quadrant Report

Why Qlik Is A Leader In Gartner's Business Intelligence & Analytics Magic Quadrant Report

Last week Gartner released the 2017 edition of its "Business Intelligence and Analytics Platforms Magic Quadrant Report," which details the latest developments in business intelligence and compares BI platforms in terms of vision and ability to execute on that vision, for those looking to invest in these type of systems.

To download a complimentary copy of Gartner's BI & Analytics Magic Quadrant Report click here.

Inside Info started delivering Qlik solutions to Australia over fourteen years ago. We did so because of a firm belief that Qlik's strategy, product vision and capabilities provided a well-needed alternative to traditional BI platforms. Qlik defined Data Discovery, led the decentralization of traditional BI to empower business users and established true, governed, self-serve analytics that can be delivered quickly. There are a few reasons why Qlik remains only one of three BI Leaders in Gartner's recent BI Magic Quadrant report.

A leading role in the BI industry

First and foremost, it's clear from Gartner's business intelligence research that Qlik is one of the leading players on the BI playing field, and it's been in that role for a long time. The Magic Quadrant listed Qlik as one of the industry leaders for a record-setting seventh year in a row. It also named Qlik Sense as one of the fastest growing products in the market, with a strong 2016 recording revenues that exceeded all expectations.

Customer experience

Gartner positioned Qlik in the Leaders Quadrant which was "driven by a robust product, an above-average customer experience and a strong global partner network." Breadth of product capability has always been a strength of Qlik and continues to be according to Gartner. As has, user enablement. Qlik's modern BI architecture makes it simple for business users to develop their own BI applications in a governed, data discovery process, without requiring assistance from IT developers, usually needed with other platforms. According to Gartner, "Qlik's ease of use for consumers and its visually appealing dashboards have proven to be product differentiators."

While in the recent BARC BI survey (the world's largest independent survey of BI users), Qlik rated #1 in customer satisfaction and customer experience, so Gartner's Magic Quadrant should also be considered in light of BARC's results.

Smart data discovery

Qlik pioneered Data Discovery BI. Qlik's associative engine (QIX) is the driving force behind Qlik applications. Not only does Qlik support integration with best-in-class natural language processing capabilities, advanced predictive analytics and enables an immersive experience including virtual reality integration through Qlik's open APIs, but the native capabilities of the associative engine and open architecture are the unique foundation for capabilities not easily replicated. The QIX engine works as people think, it intuitively seeks to understand all the possible associations that exist in user's data, across all their data sources and allows them to freely explore that data, asking questions in any direction without restrictions or boundaries. That means no predefining data hierarchies or building data cubes. In short it facilitates what many investments in neural networks are striving to achieve. It enables a unique search experience, associative data prep and profiling, data enrichments, suggestions, labeling, compression, truly smart and adaptive visualisation, and indexing across big data sources. In short it defines 'smart' from data preparation, to finding patterns in data, to sharing and operationalising findings.

Rapid (and scalable) deployment

Some are scared off by the prospect of using BI applications because of the supposedly painstaking transition process and cost involved. Gartner noted that with Qlik, this is not a problem. Qlik has proven to be easy to deploy - and moreover, easy to scale, so you can adjust your use as your business grows in size or scope.

Qlik's scalable, in-memory engine allows lines of business as well as central IT to rapidly mash data from multiple data sources that is then accessible via highly interactive dashboards. While Qlik continues to invest in developing a cloud version of the product for the enterprise, SMB versions are already available.

So what about software cost?

When you look at the Magic Quadrant it always highlights strengths and then weaknesses for each vendor. Interestingly, Gartner indicated that Qlik's cost of software as a potential barrier. It's important to look at Total Cost of Ownership (TCO) though, not just licensing. Qlik has one of the best TCO's in the business, according to Gartner in its BI Platform Ownership Cost research. While BARC's BI Survey in October 2016 rated Qlik #1 also in Project Success and Business Value among large international BI vendors (this was a survey of nearly 3,000 end-users). Almost 70% of a BI project's TCO is not found in the license costs but in deployment, infrastructure and support. For the other Leaders in the Quadrant there are several independencies, implementation costs or you simply need to buy additional tools to get the same features.

Supported by a strong Qlik partner

Whether a Qlik client feels supported or not has a lot to do with the relationship and abilities of the Partner they choose to work with. So don't underestimate this. Inside Info as I mentioned launched QlikView in Australia in 2003 as the Master Reseller and then has continued as the longest standing top level Elite Qlik Partner, having won Partner of the Year for many years as well. With over 100 Qlik reference sites, we measure our success through the quality of our people, the relationships they create and the impact we have on our client's business.

To read more about Gartner’s report, download a complimentary version of Gartner's 2017 Business Intelligence and Analytics Platforms Magic Quadrant below.

Download Gartner Report

Why Customer Analytics Matter When Building A More Intelligent Enterprise

Why Customer Analytics Matter When Building A More Intelligent Enterprise

One of the primary goals for the intelligent enterprise in 2017 should be to improve the customer experience and engage people in ways that will build brand loyalty. When customers are happier, they stay with your brand for longer, which leads directly to more robust profits.

It's important to have customer analytics that will give you tangible, specific evidence of how people feel.

In the effort to make this happen, it's important to have customer analytics that will give your enterprise tangible, specific evidence of how people feel about their customer experiences and why. This will enable decision-makers to act based on hard proof rather than gut instincts that might be mistaken.

Analytics are becoming more impactful

There's reason to believe that for years, many business leaders worldwide were underestimating the value of customer analytics in helping them make business decisions. Having clear data on how customers feel is critical, yet it has historically been neglected.

Research from McKinsey and Company supports this. In 2013, the organisation polled marketing and sales leaders on what elements they found "extremely important" for commercial success. Customer analytics ranked eighth on that list, with only 29 per cent of respondents identifying it.

This doesn't sit with reality. In that same study, McKinsey also found that when companies use BI tools to analyse their customers, they have a 54 per cent chance of outperforming their competition, versus only 28 per cent when they don't. It's clear from the data that when companies care about studying the customer, they do better. This has only become more true with time.

Mapping out the customer experience

Customers accustomed to the personalisation and ease of dealing with digital natives such as Google and Amazon now expect the same kind of service from established players. Research shows that 25 percent of customers will defect after just one bad experience. So it's time for companies to get thorough and systematic about how they study the customer. It's not enough merely to use business analytics for digging up numbers and abstractly thinking about them; superior companies will be those that map out the customer experience thoroughly, finding data-driven ways to make improvements at every turn.

If companies really go to great lengths to use BI applications for customer analytics the right way, they'll essentially be able to create "tracks" - carefully constructed journeys that are tailored to the specific needs of different types of customers. This can be complex - every customer has different needs and preferences - but with enough data, it can be done.

Once the business has a good handle on every customer's journey and how they navigate it, it will become easier to identify snags in the process. When an incident pops up that disrupts a customer's experience, the company will likely have seen the problem before and already have a preset way to address it.

Tracking performance through the lens of the consumer

Customers hold companies to high standards for product quality, service performance, and price. How can companies determine which of these factors are the most critical to the customer segments they serve? Which generate the highest economic value? In most companies, there are a handful of critical customer journeys. Understanding them, customer segment by customer segment, helps a business to maintain focus, have a positive impact on customer satisfaction, and begin the process of redesigning functions around customer needs. Analytical tools and big data sources from operations and finance can help organisations parse the factors driving what customers say satisfies them and also the actual customer behavior that creates economic value.

A key success factor is therefore to examine customer analytics holistically, including IT, analytics, and execution/organisational setup, and to pragmatically improve on all dimensions. Then use the customer journey to empower the front line. The people who power your business every day - the product developers, salespeople, customer service agents - how can they take their knowledge of the customer and use it to work more effectively every day? With the right metrics and the right BI platform to track them and pave the way forward, it becomes easier to answer this question and many others like it.

For our top 5 strategies for the 2017 Intelligent Enterprise, which includes customer empowerment, and how to use business intelligence and corporate performance management to better add value, download the ebook.

Download Ebook

Pages