Qlik Business Intelligence and Analytics

Inside Info accentuates analytics for Accent Group

Inside Info accentuates analytics for Accent Group

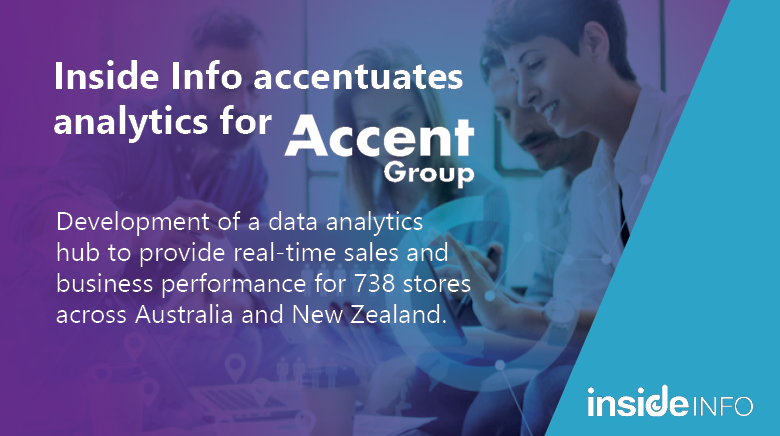
Accent Group has a network of 738 stores for 37 brands.

As an Elite Qlik partner, Inside Info helped in the development of a central data analytics hub used across fashion retailer Accent Group's hundreds of retail stores.


Having worked with Accent Group since 2015 we have a deep understanding of their business and were approached in October 2021 to develop and deliver Qlik Sense analytics dashboards providing transactional level details.

“These Qlik retail store applications as part of [phase one] were developed and delivered within eight weeks, having now been rolled out to over 500 users across Accent Group, with near real-time visibility of key sales and inventory measures,” said Inside Info director Phil Langdale.

In addition, Inside Info also provided a retail returns dashboard within Qlik Sense to monitor online and store returns for head office.

“It’s never been more important, especially in the fast-paced retail fashion space, to be first and smartest in market,” said Betty Thai, head of data and analytics for Accent Group. “That’s why we didn’t waste any time.

The plan for the hub, is to improve visibility of business performance and efficiencies, streamline onboarding processes as well as upskill the workforce in data literacy and analytics.

The latter point is already taking place, the vendor claimed, with Thai adding the addition of the platform has led to an increase in cross-store collaborations, healthy competition, and skill building.

“Betty operates a lean data analytics team inhouse, but with Qlik as partner she was able to rapidly scale up development and rollout a project that has not only upskilled an entire workforce, but also fundamentally changed the way Accent Group operates and monitors performance,” said Paul Leahy, A/NZ country manager for Qlik.

READ THE FULL ARTICLE HERE.


Qlik Rated A Leader Again In 2022 Gartner Magic Quadrant For BI & Analytics

2022 Gartner Magic Quadrant for Analytics & Business Intelligence Platforms Report

The new 2021 Gartner Magic Quadrant for BI and Analytics report is out and you can access it here.  It’s for good reason that Inside Info has chosen to specialise in designing and delivering data and analytics solutions using the Qlik platform over the last 19 years.   Seventeen vendors made the report this year, but once again only three were recognised as Leaders.  Qlik were rated once again a Leader in the quadrant for the 12th consecutive year, reinforcing the strength of the platform.  Gartner Magic Quadrant is a key reference for those businesses looking to enhance their analytics environments as it evaluates key players in the market. 

Qlik was recognised in particular for its flexibility of deployment options with Qlik Sense's open architecture for both on-premise or cloud options, its expanding portfolio of capabilities and its customer engagement and data literacy programs. 

To To learn more download a complimentary copy of the 2022 Gartner Magic Quadrant for Analytics & BI below.

Download Report


Gartner does not endorse any vendor, product or service depicted in its research publications, and does not advise technology users to select only those vendors with the highest ratings or other designation.  Gartner research publications consist of the opinions of Gartner's research organisation and should not be construed as statements of fact.  Gartner disclaims all warranties, expressed or implied, with respect to this research, including any warranties of merchantability or fitness for a particular purpose.  

Gartner and Magic Quadrant are registered trademarks of Gartner, Inc. and/or its affiliates in the U.S. and internationally and are used herein with permission.  All rights reserved. 

GARTNER and Magic Quadrant a registered trademarks and service mark of Gartner, Inc. and/or its affiliates in the U.S. and internally and is used herin with permission. All rights reserved. 

Gartner, Magic Quadrant for Analytics and Business Intelligence Platforms, Austin Kronz, Kurt Schlegel, Julian Sun, David Pidsley, Anirudh Ganeshan, 22 March 2022. 

The Gartner Peer Insights Logo is a trademark and service mark of Gartner, Inc., and/or its affiliates, and is used herin with permission.  All rights reserved.  Gartner Peer Insights reviews constitute the subjective opinions of individual and end users based on their own experiences and do not represent the views of Gartner or its affiliates. 

Gartner Peer Insights reviews constitute the subjective opinions of individual end users based on their own experiences, and do not represent the views of Gartner or its affiliates. 

Qlik Customers Rave In BARC's BI & Analytics Survey 22 Results

BARC BI & Analytics Survey 22: Qlik Highlights

The recent BARC BI & Analytics Survey 22, which is the world's largest survey of business intelligence and analytics users, continues to highlight Qlik as a leading force in the business intelligence and analytics community.  In the survey Qlik Sense earned six number one rankings and 45 leading positions in six peer groups in the annual survey of around 2,500 BI and analytics users. In particular the report highlights that: 

  • Qlik Sense ranked again 1st in Business Value in the International BI Giants peer group.
  • Qlik Sense ranked 1st for Project Length in two peer groups & rated a Leader in all peer groups. BARC notes that rapid BI implementation is a key measure of project success and that projects with rapid rollout deliver the most business benefits.
  • Qlik Sense ranked 1st for Analyses in 3 of its peer groups with 86% of surveyed Qlik Sense users rating the platform's functionality as excellent or good compared to only 75% for the average BI tool.
  • Qlik Sense holds a leading position for Query Performance across five peer groups. 

Qlik democratises analytics and BI so people at all skill levels can freely explore data. Qlik Sense is a powerful and complete SaaS analytics offering, powered by Qlik’s patented Associative Engine and advanced AI assistance through Insight Advisor. With Qlik, the entire workforce can uncover hidden insights, make smarter decisions and drive better outcomes through data.

If you'd like to know more about how Qlik compared to other BI & analytics platforms in the BARC Survey, you can download a complimentary copy below. 

Access BARC Qlik Survey Highlights

Qlik and Fortune Launch “The Pandemic Effect on the Fortune Global 500” Data Analytics Site

Qlik and Fortune Launch “The Pandemic Effect on the Fortune Global 500” Data Analytics Site

Qlik & Fortune today announced the launch of “The Pandemic Effect on the Fortune Global 500.” site. This unique data analytics site builds upon previous work with Fortune to examine the COVID-19 pandemic's effect on the Fortune 500 businesses globally. This new site, aligned with the publication of the Fortune Global 500 List, provides a journey through how the recent COVID-19 crisis has impacted the revenue and profit performance of the world's leading companies.  Similar to last year, the site details through visualisations the revenue and performance of the organisations and industry sectors that shape the 2021 Fortune Global 500, while highlighting specifics on how the pandemic affected market performance including: 

  • An overview of how COVID-19 impacted overall 2021 revenue & profit performance of the Fortune Global 500 compared to historial performance.
  • The profit impact of companies in USA, Japan & China compared to companies in the rest of EMEA, APAC & the Americas with the ability to explore individual country-level profit performance for the countries in each region. 
  • A world map that shows the pandamic's impact on individual country revenues and profit.
  • A sector-level analysis that compares the performance changes from 2020 to 2021 in key areas such as Healthcare, Engery, Finance, Technology & Motor Vehicles & Parts. 

An interesting read, so worth the look, & you get to see Qlik Sense in action.

You can access the site by clicking here.

All About Qlik Sense Enterprise SaaS

All About Qlik Sense Enterprise SaaS

At Inside Info we’ve been building and deploying Qlik analytics solutions now for 18 years and as such have seen the platform evolve greatly over time.   From the initial launch of QlikView to then Qlik Sense, we’re now seeing the growth in Qlik’s cloud deployment options of Qlik Sense.  In this article we wanted to highlight Qlik Sense Enterprise SaaS and what this has to offer.

Qlik Sense Enterprise SaaS

As part of Qlik’s cloud first strategy Qlik have developed their own cloud service, Qlik Cloud Services (QCS), on which Qlik manages cloud editions of the product portfolio to deliver to customers as software-as-a-service (SaaS) offerings. Qlik Sense Enterprise SaaS is Qlik’s premium cloud solution and gives businesses analytics without the complexities of installing and managing their own deployment, with a 99.9% uptime commitment from Qlik. Based on our experiences this SaaS version of Qlik Sense Enterprise is every bit as robust as the on-premise version.

The microservice-based architecture behind Qlik Sense Enterprise SaaS allows Qlik to host both Qlik Sense and QlikView® applications (apps) in a customer’s Qlik Sense Enterprise SaaS tenant. This means users have a single location to open and consume their Qlik apps. In addition to hosting Qlik apps, Qlik Sense Enterprise SaaS provides the ability to add links to other types of reports and assets such as documentation, providing a single portal for your users to consume all your analytics and reporting assets.

Associative In-Memory Apps

Qlik couples in-memory data storage technology with an Associative Engine that lets you analyse and freely navigate data intuitively. In its second generation, Qlik’s Associative Engine allows users to easily explore data and create visualisations based on data from multiple data sources simultaneously. These sources range from Excel and Access to databases such as Oracle and SQL Server to big data sources such as Cloudera and Redshift. Qlik Sense uses columnar, in-memory storage. Unique entries are only stored once in-memory, and relationships among data elements are represented as pointers. This allows for significant data compression, more data in RAM, and faster response times for your users. In some big data scenarios, data should remain at the source, which is why Qlik uses a built-in technique called On-Demand Application Generation. Data sources can be queried based on your users’ selections, yet still provide an associative experience to your user. Qlik’s Dynamic Views feature expands this capability further for the biggest data sources available.

User Interfaces

Access to the Qlik Sense Enterprise SaaS environment is through a zero-footprint web browser interface (known as the Qlik Sense Hub). The Qlik Sense web browser interface makes all aspects of development, drag-and-drop content creation, and consumption possible. Qlik Sense features a responsive design methodology to automatically display and resize visualisations with the appropriate layout and information to fit the device — whether it is a browser on a laptop or desktop, tablet, or smartphone. Built with current standards of HTML5, CSS3, JavaScript, and web sockets, Qlik Sense enables you to build and consume apps on any device. In addition to the web-based interface, Qlik Sense supports conversational analytics which integrates with major chat platforms such as Slack and MS Teams and data alerting capabilities to allow users to subscribe to and be notified of key changes to their data.

Notifications & Alerts

Notification capabilities allow users to configure Qlik Sense Enterprise SaaS system-based events. These events include status of application reloads, and your users’ status in Spaces. Users have control over their notification subscriptions, managing which channel (e-mail or web) they would like to receive them, as well as for opting to unsubscribe at any time.

Enterprise Data Capacity

Each Qlik Sense Enterprise SaaS tenant provides fully expandable storage and with a standard Qlik Sense Enterprise subscription, each Qlik Sense app can consume up to 5 gigabytes of memory. Qlik Sense Enterprise SaaS scales to meet the demand that is required on system resources with no requirements on users to configure any of the infrastructure. Certain use cases may require apps that use more than 5 gigabytes of memory. Qlik provides an Expanded Apps option for applications between 5 gigabytes and 10 gigabytes in memory. For apps larger than 10GB in memory, or workloads that require even larger capacities, Qlik offers a Dedicated Capacity option.

Move Apps Through A Development Lifecycle, Not Development Servers

With Qlik Sense Enterprise SaaS, apps are stored in discrete spaces. Each space has its own security settings, data connections and file storage. Customers can create as many development, test and production spaces as needed to suit their software development life cycle. This approach allows much greater flexibility, agility and reduced infrastructure expense than with a traditional on-premise setup.

Integrate On-Premise Data With SaaS

Qlik provides several solutions to integrate on-premise data sources with Qlik Sense Enterprise SaaS, such as Qlik DataTransfer.  This is great for customers who do not require either a full data integration solution such as Qlik Catalog™ or a full Qlik Sense Enterprise Client-Managed deployment and do not wish to open firewalls to connect to on premise data. Qlik’s Data Integration platform which provides the ability to publish data from a wide breadth of data source end points to cloud storage locations works with Qlik Sense Enterprise SaaS.  In particular Qlik Replicate (Qlik’s universal data replication and real time data ingestion), Qlik Catalog (A secure, enterprise-scale data catalog to easily find, prepare & deliver analytics ready data) and Qlik Compose (Agile data lake creation and data warehouse automation).

Qlik Sense on premise applications can be automatically synchronized with Qlik Sense Enterprise SaaS, while QlikView Publisher allows QlikView apps to be published to Qlik Sense Enterprise SaaS.

As you’d expect Qlik has start of the art site reliability, security and backup procedures in place as you’d expect form any enterprise level SaaS option.

For existing Qlik Sense Enterprise customers, Qlik Sense Enterprise SaaS has the capability to facilitate the transition to SaaS. Customers can choose to continue reloading apps on premise, move some apps to Qlik Sense Enterprise SaaS or use Qlik Data integration tools to access their data sources on-premise while moving consumption to the cloud. Integrated identity providers and flexible deployment and subscription options make this easy to manage and minimizes costs during the transition.

If you’d like to know more about Qlik Sense Enterprise SaaS download the Qlik Sense Enterprise SaaS Technical Overview Whitepaper below.

Download Whitepaper
CDAO Online A/NZ 20-21 April 2021

CDAO Online A/NZ 2021
Inside Info & Qlik have sponsored this year's CDAO Online A/NZ event which will be held 20-21 April.  A great line up of speakers with topics covered including:  
  • Accessible & Actionable Data
  • Data Quality
  • Customer Data
  • ApplyingAnalytics
  • Data Governance
  • AI Innovation
  • Data for Life
  • Teams, Talent & Diversity
If you'd like to know more about the event visit https://cdao-anz.coriniumintelligence.com/ to view the agenda & to register.  Registrations are complimentary. 

The Importance Of Investing In Data & Analytics Pipelines

The Importance Of Investing In Data & Analytics Pipelines

A recent article by Joe DosSantos, Qlik’s Chief Data Officer, spoke about the cost of missed opportunity due to not effectively using data and the monumental impact this can have on businesses.  As businesses are amassing more and more data and adopting sophisticated data and analytics solutions, many are still struggling to convert this investment into better decision making and tangible business outcomes.  One way to improve this is to ensure that the right data feeds into these systems by investing in data and analytics pipelines such as data cataloguing, to ensure a better output.

So let’s first look at research that Qlik and IDC conducted in late 2020. This research revealed that:

Organisations with data pipelines that support the best decision-making capabilities are experiencing the greatest improvements in business value, achieving over two-times more than those with the worst decision-making capabilities (38% v 15% respectively).

While organisations have continued to invest in new solutions that promise to harness the full value of their data, what many often do not realise is that there is only so much data analytics can do. There is a finite value that can be achieved from data - if you’re not putting enough or the right data into your data pipeline, you are significantly limiting the outcomes you can achieve from it. 

How To Identify Valuable Data

Data pipelines are the backbone of modern data systems.  Finding and introducing more valuable data into your data pipeline is something that nearly all businesses are grabbling with. Among global business leaders, 96% report that identifying new data sources is challenging for their organisation. This is consistent across every industry and most regions - only companies in Japan and Germany reported a lower rate (89% respectively).

In fact, just over half (57%) of global businesses believe they have identified and captured most (70+%) of the potentially valuable data across their organisation. Business leaders report facing both technical issues of having the resources to search for and invest in the technology to create valuable data, and challenges in understanding its validity and assessing the potential ROI. It is therefore little surprise that, when asked which area of their data pipeline would receive the greatest investment over the coming 12 months, one quarter of business leaders (25%) reported focusing on identifying new data sources.

Using Data Catalogues To Improve Data Discovery

One way to support individuals in identifying the valuable data in their organisation that can be used to inform decision-making is to use a data catalogue. Data cataloguing establishes a single repository of all the data a business has available for analytics so that anyone - from data engineers to business users - can identify and access it.

An important consideration when investing in a data catalogue must be its accessibility for non-technical users. Functionalities like keyword search, which enable users to find potentially relevant data sets that can be exported into visualisations or analytics dashboards, are important so they are empowered to find the information relevant to their decision. Of course, this cannot be at the cost of privacy, so should be balanced against a common framework of security, governance, and metadata capabilities that protect data, manage user access privileges and track their activity.

Investing In Data Pipelines To Get More Out

Without the right information, it’s tough to spot trends, identify new opportunities and, most of all, be confident that you’re making the right decisions.  Inside Info can help businesses improve their data pipelines by simplifying and accelerating cataloging, management, preparation and delivery of business-ready data to analytics tools using Qlik’s approach to data integration.  It’s time that organisations recognise the benefits of investing in the beginning, as well as the end of their data pipelines. Because what you get out of it depends entirely on what you put in.

To understand more about the importance of investing in data and analytics pipelines read the IDC report below.

Download Report

Qlik Named by Gartner as a Challenger in the 2020 Magic Quadrant for Data Integration Tools

Qlik Named by Gartner as a Challenger in the 2020 Magic Quadrant for Data Integration Tools

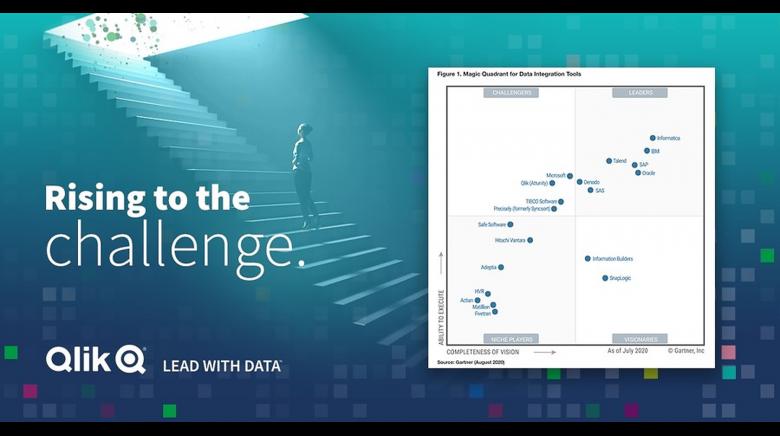
Gartner has released its 2020 Data Integration Magic Quadrant* & Qlik (Attunity) has once again been rated as a Challenger in the report.  Gartner beliieve the data integration tools market is seeing renewed momentum driven by urgent requirements for hybrid/multicloud data management, augmented data integration & data fabric designs.   

According to Gartner among Qlik's strengths include the fact that it's proven in data replication scenarios with its robust CDC-based replication capabilities & the platforms ease of use. This includes ease of installation and configuration, automated code generation and nonintrusive implementation. Another key strength of Qlik according to Gartner is that it has successfully integrated its Attunity acquisition with the rest of its portfolio including Qlik Catalog and Qlik Sense to support a consstent experience from data ingestion/integration, to data cataloging, to real-time and batch analytics. 

Like to know more, download a complimentary copy of the Gartner report below, or contact Inside Info today. 

Download Report


*Gartner, Magic Quadrant for Data Integration Tools, Ehtisham Zaidi, Eric Thoo, Nick Heudecker, Sharat Menon, Robert Thanaraj, 18 August, 2020.

Gartner Disclaimer
Gartner does not endorse any vendor, product or service depicted in its research publications and does not advise technology users to select only those vendors with the highest ratings or other designation. Gartner research publications consist of the opinions of Gartner's research organisation and should not be construed as statements of fact. Gartner disclaims all warranties, expressed or implied, with respect to this research, including any warranties of merchantability or fitness for a particular purpose.

BARC's BI Survey 19 - Qlik Highlights

BARC BI survey 19 Qlik Highlights

Qlik Highlights Report

If you haven't already seen it, BARC released its BI Survey 19 results.  The BI Survey 19 report is a good way to find out what end users really think about the BI products they use. Based on a sample of over 3,000 survey responses, The BI Survey 19 offers user feedback on 36 leading BI solutions. We can share with you here the Qlik highlights in this report. 

Qlik was voted #1 for customer experience and performance satisfaction.

For a breakdown on Qlik's overall performance, including by Qlk Sense and QlikView, download the BARC highlight's report below. 

Download Report

The Key To Data-Driven Digital Transformation: Qlik's 3rd Generation BI Approach

Qlik's 3rd Generation BI Approach

The business intelligence (BI) and analytics landscape has and is continuing to evolve rapidly in Australia. We’re now heading into what’s termed as 3rd Generation BI to help businesses better harness the potential within their data for competitive edge.  Qlik is at the forefront of this new approach that revolves around a crucial principle, the democratisation of analytics. Here we’ll explore how BI has evolved and what makes Qlik’s 3rd Generation BI platform and approach unique.

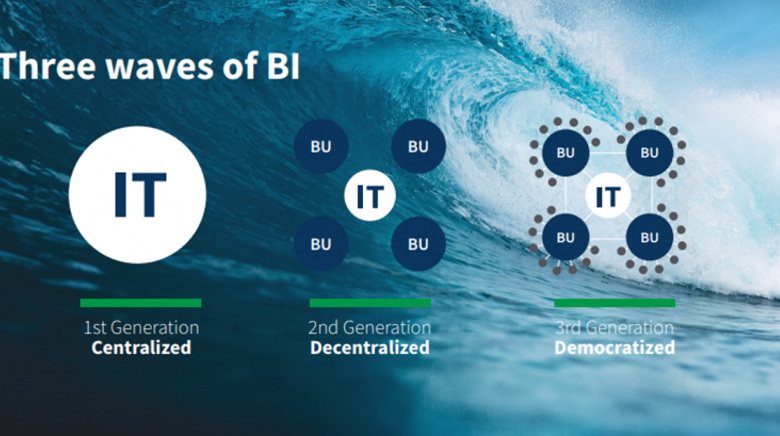
Data has always held tremendous value, but for decades, most of that value has remained inaccessible due to technical limits and complexities. The centralised approach of the 1st generation of BI, known as ‘The Ask/Wait/Answer Cycle’, was based on a centralised approach to BI, usually too reliant on a few people within IT that possessed the necessary technical skills, often overworked and under resourced, and therefore slowed down and diluted the full potential of value from analytics.

With the 2nd-generation of BI, a user-friendly, more decentralised approach to data emerged and eliminated technical complexities and enabled users to freely explore and discover connections within their data. This data discovery approach to BI emphasised data visualisation, self-serve analysis and transformed how users engage with data. But as the technology gained the capacity to analyse more types of data, the need to develop a secure and governed structure to deliver accurate data and reliable analysis also grew.

What has remained steady throughout an era of rapid technological development is Qlik’s pioneering and innovating ethos. The decentralised approach of 2nd generation BI has been the stepping stone to the development of a new wave of BI- the 3rd generation. Nonetheless, data literacy has persistently remained an obstacle as insight without action cannot lead to value. As of 2017-2018, only 24% of business users considered themselves to be data-literate in a study conducted by Qlik.

The need for data literacy is crucial, Gartner talk about this in their latest 2019 Analytics & Business Intelligence Magic Quadrant Report, as data is the currency of the digital economy. The ability to extrapolate intelligence and anticipate customer needs to fully capitalise on discoveries requires available data to be accessible and actionable throughout the entirety of your organisation, in turn transforming how a business operates.

The 3rd Generation approach to BI is about bridging this data literacy gap, still enabling users to freely explore data to garner insights in the way they need to but with structure and data governance in place. This is about democritising analytics.  Qlik is one of the BI platforms pioneering this innovative BI approach. 

What makes Qlik’s 3rd generation BI approach truly unique?

The answer is in the interaction of three innovative technologies as the foundation of Qlik’s 3rd generation BI approach, which also encourages more widespread adoption of analytics across the organisation.

The three-pronged approach underlying Qlik’s 3rd-Generation BI Platform:

1. The Democratisation of Data

All data and any combination of data is accessible to all users through governed, analysis-ready, enterprise-wide information catalogues. Qlik’s approach enables the creation of an enterprise-wide data schema that fully integrates all your data, from any source, regardless of how big it is or where it’s stored.

2. Associative Indexing Engine - Augmented Intelligence = AI2

Qlik combines the power of machine learning with human intuition, highlighting new insights and accelerating discoveries for users to explore whilst also increasing data literacy and trust. This combination of Associative Index with Augmented Intelligence (AI2) simplifies advanced analytics, eliminates bottlenecks, and elevates data literacy and insights. Like the unique Associative Indexing technology, Augmented Intelligence combines human interactions with machine identified patterns. The Associative Technology maps associations among all the data, preparing it for analysis and creating meta-data and indexes that represent the data.

3. Embedded Analytics from the Edge to the C-Suite

Qlik’s open and extensible platform allows analytics to be deployed or embedded in a range of environments from enterprise servers to public cloud infrastructure to edge devices and IoT applications. This means analytics enters the streams of daily business processes from edge devices all the way to your core applications within the business. 

Why 3rd Generation?

Combined, Qlik’s approach helps businesses extract the most value possible from their data for competitive advantage, making it easier to prompt and discover insights and trends within the data, regardless of the level of technical skill of the user. Qlik has managed to strip out the complexity, technical limits, resource bottlenecks and skills gaps that have previously kept analytics out of the hands of business users. A radically different approach that will help achieve data driven digital transformation and competitive advantage for businesses.  

To find out more read the full report in this whitepaper, “3rd-Generation BI: Unlocking All the Possibility in Your Data”, to discover Qlik’s innovative approach to BI.  

Download Report

Pages