Subscribe To Our Blog!
Keep up with the latest discussions, industry trends, and customer news.
Sign me up!

Categories
Advanced Analytics (22)
Data Modelling (1)
Machine Learning (1)
Data Warehouse (2)
Inside Info (8)
Data Integration (2)
Analyst Reports (11)
Business Analytics (102)
Improving Business Performance with Collaborative Data Analytics
By on May 19, 2016

There's little argument that, as we continue to move deeper into the digital age, collecting, analysing and utilising business data has evolved into a critical strategic imperative for most organisations. Innovative technology has allowed us to accrue vast amounts of information, but understanding how to best use it can still pose challenges.
Research from IDC estimates that the value of the big data and analytics market in Asia Pacific (excluding Japan) will continue to grow to US$7 billion by 2019. IDC also found over half of the region's organisations have recognised the importance of these business tools, and have either invested in their use already or plan to do so in the near future.
If your organisation isn't quite onboard with the data revolution just yet, or hasn't achieved widespread adoption of your analytics tools, it can be a little unclear how other businesses are benefiting from analysis. According to Sherrel Roche, IT Services Senior Market Analyst, IDC Asia Pacific, struggling to grapple with large amounts of information isn't uncommon.
"Enterprises are overwhelmed with massive amounts of data, and additionally, mobility and Internet of Things (IoT) are adding to this exponential growth and complexity," she says.
How are organisations leveraging business data?
The use of valuable business data and the data collected is likely to vary depending on the particular industry that an organisation operates in and what KPI's are relevant. What's useful for distribution, for example, may not have the same application for manufacturing. One aspect common to almost any business, however, is self-serve analytics.
Self-serve analytics is about providing business users with the ability to either create or use intuitive dashboards, to enable fast drill-down and query of data and performance themselves, without having to continually refer back to IT or wait for distributed reports. That way, speeding up the process in finding trends and patterns that may influence future strategic decisions across each aspect of operations.
This might involve learning which areas of a retail store see the most foot traffic, and adapting the layout strategy to capitalise on high volumes of customers. Perhaps a logistics company is seeking to identify where bottlenecks in its process is leading to delays - self-serve data analytics will allow a granular view of operations and streamline for greater efficiency.
Ther's almost no limit to the insight an organisation can gather from data analytics, and with new innovations and technology being developed, new applications are being discovered all the time.
Taking a top down approach to data
As mentioned, the potential benefit through better use of data is huge, and analytics can be implemented at all levels of an organisation. To get the most out of your business data, taking a holistic approach is a smart strategy - that means starting at the highest levels.
According to a survey by McKinsey & Company, involving senior leadership members of an organisation in analytics activities has a huge impact on their effectiveness. Among companies with high performing data analytics strategies, including senior management in the strategy was seen as the most significant factor for successful deployment.
Meanwhile, making data accessible across the entire organisation also contributes to success, being a factor in 64 per cent of the high performing businesses surveyed by McKinsey. To achieve this level of collaboration, a platform for data analysis needs to be intuitive and easily accessed. McKinsey also found that delivering a self-serve analytics capability for business users was also a top scoring critical success factor.
Making data accessible with Qlik
Qlik provides a business intelligence platform that delivers comprehensive, self-serve analytics that is also easy to maintain, integrate and use, via QlikView and Qlik Sense. With smart visualisations and data storytelling, understanding and making use of business data is more easily communicated and shared. Able to incorporate multiple sources of data, you'll be able to unlock the potential of your collected information sooner, and begin improving business performance in no time.
For more advice about how smarter data analytics can benefit your organisation, speak to Inside Info today.

Sonia Johnson
Sonia Johnson heads Inside Info's Marketing team, as an experienced B2B marketer, having launched and built the Qlik brand in the Australian market. Sonia has 20 years' experience working within the IT and telco industries, having worked for IBM and Vodafone, the last ten years have been focused within the business intelligence and corporate performance management sectors.
Related Articles
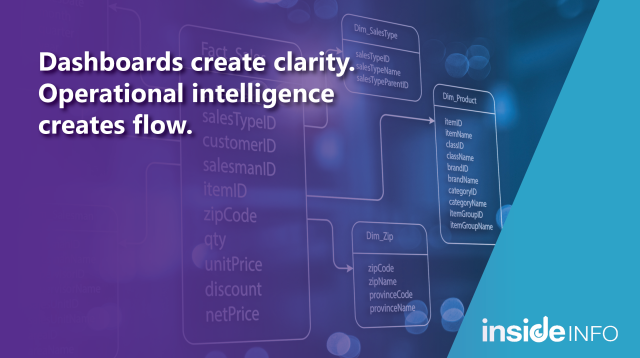
The question isn’t simply whether we can see what’s happening, because in most organisations, we can. The more pressing conversation now is what we do with that data and clarity.
By
on Mar 16, 2026