Latest News

Studies have shown that 90% of the information processed by the brain is visual, and people remember visual data 65% better than text alone (Source: MIT).
By
on Jun 20, 2025
Subscribe To Our Blog!
Keep up with the latest discussions, industry trends, and customer news.
Sign me up!
Categories
Advanced Analytics (22)
Data Modelling (1)
Machine Learning (1)
Data Warehouse (2)
Inside Info (8)
Data Integration (2)
Analyst Reports (11)
Business Analytics (102)
Latest News

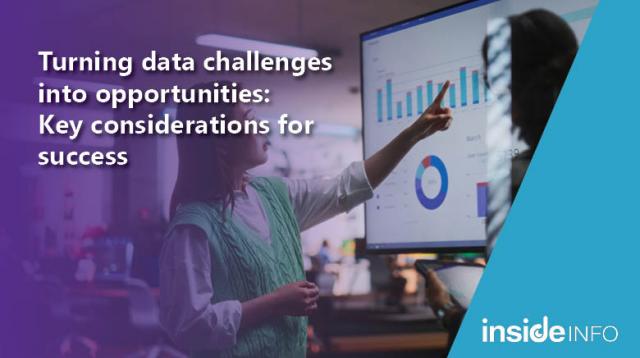
Trust in data is not just about ensuring numbers line up, it’s about creating a foundation where leaders can confidently rely on data to forecast trends, develop strategies and make predictions that drive future success.
By
on Feb 12, 2025
Legacy systems, data silos and the sheer volume of information often lead to confusion, inaccuracy and missed opportunities. Here, we explore the common challenges businesses face in data management.
By
on Feb 12, 2025

According to a report by Forrester, 60-73% of enterprise data goes unused for analytics, meaning that despite significant investments in data tools, most businesses aren’t harnessing the full potential of their information.
By
on Feb 12, 2025
Qlik Talend Cloud helps simplify how data flows, transforms, and delivers value, giving your business the clarity and agility to move with confidence.
By
on Nov 3, 2025
Explore how to seamlessly integrate Qlik Sense into strategy to enhance data-driven decision-making and optimise return on investment (ROI).
By
on Jan 31, 2024

With greater demands being placed on business to modernise and utilise data to make rapid decisions, how do you ensure you evolve to retain your competitive advantage?
By
on Dec 15, 2022

Results from the world's largest survey of BI & analytics users are in. Qlik was rated #1 in 6 categories including for business value, project length & analyses. Access the report here.
By
on Mar 17, 2022

Qlik tells the data story behind how leading global businesses performed in these unprecedented times with the launch of “The Pandemic Effect on the Fortune Global 500.” site with Fortune.
By
on Aug 3, 2021
- 1 of 15
- Older Posts