Many organisations have invested in Infor M3 ERP systems - previously known as Lawson - to streamline financial and operational processes across their businesses. While Infor M3 is recognised as best-in-class, it can sometimes struggle with business intelligence (BI) - especially when integrating with non-Lawson third-party systems. We frequently hear Infor M3 users talk about the difficulty of accessing and analysing their M3 data with or without in-built BI systems, with reports that only take users part-way to the insights they need.
Built for centralised reporting, Infor M3 and most add-on BI tools lack the flexibility to meet new reporting and analysis demands. This is especially true when requirements include combining M3 data with information from other sources and when large data volumes cripple performance. The inherent complexities, lack of speed and usability, and time-intensive nature of these approaches for reporting, hinders executives and analysts from improving decision-making and business performance. As a result, M3 users can often lack visibility into their business processes and critical insights that remain hidden away inside the system.
Inside Info's Director and Qlik Managing Consultant, Phil Langdale, is speaking at the Infor M3 Users Network (IMUN) annual conference, held on the Gold Coast on 17-19 May 2017, about how to use analytics to reshape the entire organisation for those running Infor M3. In particular, Phil will discuss how many of our other clients who are running Infor M3 are using the leading Qlik business intelligence platform to transform operations and deliver interactive, on-demand analysis and dashboards for Infor M3 and other data, delivered in just a few weeks.
Rethinking Information Needs
The growing need for broader data literacy among executives and business teams requires a rethink of how information needs are addressed within organisations. For those businesses running Infor M3, that means rethinking how to better leverage M3 and other data to provide self-service intuitive dashboards and analytics that engage all types of users - from executives to analysts and operational team members. When used correctly, key insights can be delivered quickly and provide a consolidated, consistent view of performance across the enterprise for more effective, agile decision making.
The Inside Infor M3 BI Dashboard
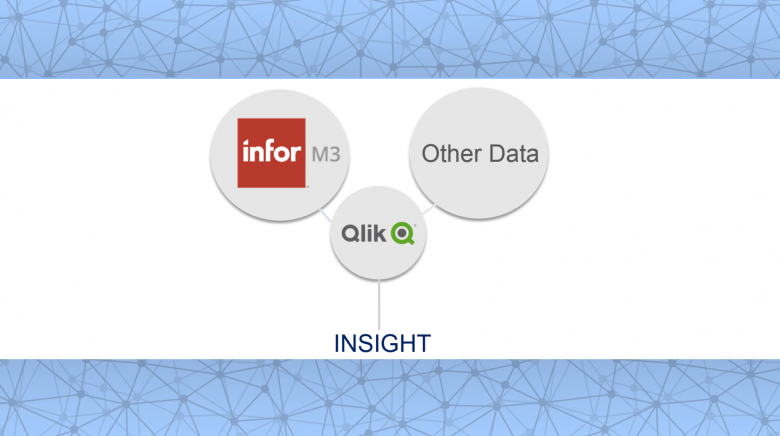
In particular, our experiences with Infor M3/Lawson have allowed us to develop the Inside Infor M3 Dashboard - a proven, best-practice business application developed by our senior consultants. Already used by firms like GWA and Manassen Foods, the solution delivers extraordinarily sophisticated interactive analysis and a consolidated view of performance, through analysis that is highly visual and affordable, and quick and easy to deploy, use and change.
"When I first saw what Inside Info could do with Qlik and our data, I was immediately impressed. Qlik provides our brand, sales, management and operational teams with complete transparency," says Wayne McIntosh, Finance Director, Manassen Foods.
The Inside Infor M3 Dashboard significantly fast tracks BI projects and increases user adoption by leveraging off the learnings of others, with customers typically up and running in about 30 days. This dashboard - based on the Qlik business intelligence platform, provides a:
- One-screen view of all the facts: Consolidating data from Infor M3 and other sources to ensure cross-functional visibility, providing a clear view of sales, inventory, service levels, customers, financial and other operational performance. A number of filters allow you to understand key measures against budget over any time period, and conduct comparative analysis. Additionally, the solution allows linking of transactional processes, dramatically improving business strategies and uncovering opportunities.
- Consolidated view across multiple businesses and divisions: The dashboard provides a single view of financial and operational performance across companies within a group or individual business areas - often difficult to achieve with other BI tools given multiple and varied data sources - and drill-down access to any area of the business.
- Near real-time visibility into operations: Instead of out-of-date reports, the dashboard offers on-demand self-serve analysis of data, often replacing hundreds of OLAP-based reports and empowering users to perform their own analysis, reducing IT support by up to 90 per cent. Users report 54% less time accessing information and 51% less time analysing it, according to IDC.
- Rapid response times: Sub-second query response on very large data volumes - into the hundreds of million records - without losing transactional level detail, with data refreshing as often as your underlying source systems.
- Comprehensive views with granular detail: Ability to view information at a detailed, transactional-level, and anywhere in between in any path decided by the user, with no pre-defined drill-down paths. If you've got a business question, odds are you'll be able to answer it without having to wait for another report. Easy consolidation of data from any and multiple data sources.
- Simple to use, available everywhere: Access your dashboard from any device - whether this be laptop, tablet, a web browser or your mobile device, with HTML5 compliance ensuring a consistent experience on each.
- Very fast implementation cycles: A typical project lasts 30 days and is 53 per cent of the total cost of other BI solutions, according to IDC. Meanwhile, adding in a new data source or building a new view of the data can be modified very easily within a few hours.
To understand more about how Inside Info can help organisations make the most of their Infor M3 and other data, check out this Manassen Foods case study below.